The reason could be extra burning of cpu in an Oracle source code function with time which has not been instrumented as a wait in the RDBMS kernel. One way to find out which function in the Oracle source code is the culprit is via the dbx collector function available in the Sun Studio 11. I guess dtrace would also help but I haven’t played with it. This tool can also be used in diagnosing increased cpu usage of Oracle tools across different RDBMS versions.
Let us take a simple example on how to run this tool on a simple insert statement.
SQL> create table foo ( a number);
Table created.
> sqlplus
SQL*Plus: Release 10.2.0.3.0 - Production on Sat Jul 14 23:46:03 2007
Copyright (c) 1982, 2006, Oracle. All Rights Reserved.
Enter user-name: /
Connected to:
Oracle Database 10g Enterprise Edition Release 10.2.0.3.0 - 64bit Production
With the Partitioning, Real Application Clusters, OLAP and Data Mining options
SQL> set sqlp sess1>>
sess1>>
Session 2
Find the server process servicing the previously spawned sqlplus session and attach to it via the debugger.
> ps -ef | grep sqlplus
oracle 20296 5857 0 23:47:38 pts/1 0:00 grep sqlplus
oracle 17205 23919 0 23:46:03 pts/4 0:00 sqlplus
> ps -ef | grep 17205
oracle 20615 5857 0 23:47:48 pts/1 0:00 grep 17205
oracle 17237 17205 0 23:46:04 ? 0:00 oracleTEST1 (DESCRIPTION=(LOCAL=YES)(ADDRESS=(PROTOCOL=beq)))
oracle 17205 23919 0 23:46:03 pts/4 0:00 sqlplus
> /opt/SUNWspro/bin/dbx $ORACLE_HOME/bin/oracle 17237
Reading oracle
==> Output trimmed for brevity.
dbx: warning: thread related commands will not be available
dbx: warning: see `help lwp', `help lwps' and `help where'
Attached to process 17237 with 2 LWPs
(l@1) stopped in _read at 0xffffffff7bfa8724
0xffffffff7bfa8724: _read+0x0008: ta 64
(dbx) collector enable
Session 1
==================================================================
begin
for i in 1..1000
loop
insert into foo values(i);
end loop;
end;
/
Session 2
==================================================================
(dbx) cont
Creating experiment database test.3.er ...
Reading libcollector.so
Session 1
==================================================================
PL/SQL procedure successfully completed.
sess1>>exit
Disconnected from Oracle Database 10g Enterprise Edition Release 10.2.0.3.0 - 64bit Production
With the Partitioning, Real Application Clusters, OLAP and Data Mining options
Session 2
=========
execution completed, exit code is 0
(dbx) quit
The debugger creates a directory called test.1.er.
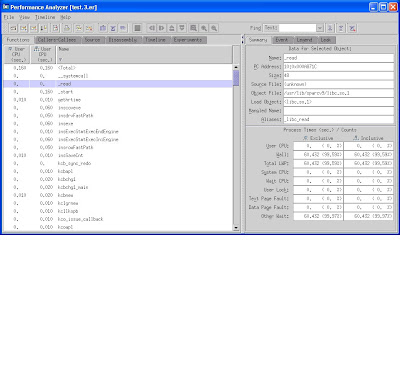
You can analyse the collected data by using analyser which is a GUI tool.
> export DISPLAY=10.59.49.9:0.0
> /opt/SUNWspro/bin/analyzer test.3.er

You can also generate a callers-callees report using the following syntax
/opt/SUNWspro/bin/er_print test.3.er
test.3.er: Experiment has warnings, see header for details
(/opt/SUNWspro/bin/er_print) callers-callees
A before and after image of the performance problem would help in diagnosing the function in the code which consumes more CPU with time.
1 comment:
Great summary on DBX for oracle!
Have you been able to use the Solaris port of DBX for Linux? I am trying to do some traces with DBX for Oracle 11g on Red Hat Linux. I can start the DBX trace but when I try to enable the collector for DBX, it fails with errors:
(dbx) collector enable
dbx: Not supported for an attached process on Linux; collector remains disabled
Regards,
Ben Prusinski
http://oracle-magician.blogspot.com
Post a Comment