Am currently working on how best to use compression techniques in an OLTP environment on a current 10g database which is due to be migrated to 11.2 in the next 6 months and I came across this OTN note
http://www.oracle.com/technology/products/database/compression/compression-advisor.html
The following statement got me very interested
This package can be used on Oracle Databases running Oracle Database 9i Release 2 through 11g Release 1.
A compression advisor (DBMS_COMPRESSION) comes packaged with Oracle Database 11g Release 2.
So lets give it a try...
I downloaded the package and compiled it..
SQL> @dbmscomp.sql
Package created.
Synonym created.
Grant succeeded.
No errors.
SQL> @prvtcomp.plb
Package body created.
Synonym created.
Grant succeeded.
No errors.
SQL> set serveroutput on
SQL> exec dbms_comp_advisor.getratio('OWNER1','CROSS','OLTP',1);
Invalid Compression option for the current COMPAT setting
Thankfully the package body is not encrypted and a quick look at the code reveals that it does the following
SQL> create table DBMS_COMPRESSION_TEMP_UNCMP as select /*+ full('CROSS') */ * from cross sample block( 1);
Table created.
SQL> create table DBMS_COMPRESSION_TEMP_CMP compress for all operations as select * from DBMS_COMPRESSION_TEMP_UNCMP;
create table DBMS_COMPRESSION_TEMP_CMP compress for all operations as select * from DBMS_COMPRESSION_TEMP_UNCMP
*
ERROR at line 1:
ORA-00922: missing or invalid option
Hmmm... not sure how they expect "compress for all operations" to work in a pre 11g database...
Saturday, December 05, 2009


Friday, September 18, 2009
Interrupting Flashback Database
So a user called me up and said he was flashing back a database and he was not too happy with the amount of time it was taking to complete the operation and so he did a Ctrl-C...
When he tried to open the database this is what he saw..
==================================================================================
SQL> shutdown abort
ORACLE instance shut down.
SQL> startup
ORACLE instance started.
Total System Global Area 838860800 bytes
Fixed Size 2033832 bytes
Variable Size 520099672 bytes
Database Buffers 310378496 bytes
Redo Buffers 6348800 bytes
Database mounted.
ORA-38760: This database instance failed to turn on flashback database
SQL> alter database flashback off;
Database altered.
SQL> alter database open;
alter database open
*
ERROR at line 1:
ORA-38760: This database instance failed to turn on flashback database
===>... Well he just turned off flashback..
SQL> alter database open resetlogs;
alter database open resetlogs
*
ERROR at line 1:
ORA-01139: RESETLOGS option only valid after an incomplete database recovery
==================================================================================
Looking through the alert.log
Fri Sep 18 08:35:05 2009
flashback database to restore point TEST_AFTER
Fri Sep 18 08:35:05 2009
ORA-38757 signalled during: flashback database to restore point TEST_AFTER...
Fri Sep 18 12:00:48 2009
No errors in the RVWR process trace file
So I just dropped the restore point and voila
> drop restore point TEST_AFTER;
Restore point dropped.
> select flashback_on from v$database;
FLASHBACK_ON
------------------
NO
> alter database open;
Database altered.
When he tried to open the database this is what he saw..
==================================================================================
SQL> shutdown abort
ORACLE instance shut down.
SQL> startup
ORACLE instance started.
Total System Global Area 838860800 bytes
Fixed Size 2033832 bytes
Variable Size 520099672 bytes
Database Buffers 310378496 bytes
Redo Buffers 6348800 bytes
Database mounted.
ORA-38760: This database instance failed to turn on flashback database
SQL> alter database flashback off;
Database altered.
SQL> alter database open;
alter database open
*
ERROR at line 1:
ORA-38760: This database instance failed to turn on flashback database
===>... Well he just turned off flashback..
SQL> alter database open resetlogs;
alter database open resetlogs
*
ERROR at line 1:
ORA-01139: RESETLOGS option only valid after an incomplete database recovery
==================================================================================
Looking through the alert.log
Fri Sep 18 08:35:05 2009
flashback database to restore point TEST_AFTER
Fri Sep 18 08:35:05 2009
ORA-38757 signalled during: flashback database to restore point TEST_AFTER...
Fri Sep 18 12:00:48 2009
No errors in the RVWR process trace file
So I just dropped the restore point and voila
> drop restore point TEST_AFTER;
Restore point dropped.
> select flashback_on from v$database;
FLASHBACK_ON
------------------
NO
> alter database open;
Database altered.
Sunday, June 28, 2009
Are you sure you will be able to activate your standby??
A couple of weeks I faced a scenario where the standby database crashed
On looking at the alert.log I see the following message in the alert.log of the standby
***********************************************************
Sat Jun 6 06:48:52 2009
Recovery interrupted!
cannot find needed online log for redo thread 1
Some recovered datafiles maybe left media fuzzy
Media recovery may continue but open resetlogs may fail
Sat Jun 6 06:48:53 2009
Errors in file /u01/app/oracle/admin/TEST/bdump/test1_mrp0_24533.trc:
ORA-10576: Give up restoring recovered datafiles to consistent state: some error occurred
ORA-16037: user requested cancel of managed recovery operation
Some recovered datafiles maybe left media fuzzy
Media recovery may continue but open resetlogs may fail
Sat Jun 6 06:48:54 2009
Waiting for MRP0 pid 24533 to terminate
************************************************************
Hmmm... this means that if the standby does not have the redo and cannot get it from the primary you will not be able to online media fuzzy files using supported methods
The same issue is explained in Bug 5956646
as an architectural limitation.
This is a very unlikely scenario but a possibility none the less
On looking at the alert.log I see the following message in the alert.log of the standby
***********************************************************
Sat Jun 6 06:48:52 2009
Recovery interrupted!
cannot find needed online log for redo thread 1
Some recovered datafiles maybe left media fuzzy
Media recovery may continue but open resetlogs may fail
Sat Jun 6 06:48:53 2009
Errors in file /u01/app/oracle/admin/TEST/bdump/test1_mrp0_24533.trc:
ORA-10576: Give up restoring recovered datafiles to consistent state: some error occurred
ORA-16037: user requested cancel of managed recovery operation
Some recovered datafiles maybe left media fuzzy
Media recovery may continue but open resetlogs may fail
Sat Jun 6 06:48:54 2009
Waiting for MRP0 pid 24533 to terminate
************************************************************
Hmmm... this means that if the standby does not have the redo and cannot get it from the primary you will not be able to online media fuzzy files using supported methods
The same issue is explained in Bug 5956646
as an architectural limitation.
This is a very unlikely scenario but a possibility none the less
Tuesday, January 27, 2009
Outbound_connect_timeout
Outbound_connect_timeout comes into play when nodes in a cluster are down and we cannot wait for the OS timeout as this causes long delays in connect time. For example on Solaris the value of tcp_ip_abort_interval = 180000 ==> which is 180 seconds ==> 3 mins
In this post I will demonstrate how outbound_connect_timeout (OCT) can effectively avoid timeouts experienced by clients connecting to RAC nodes
If we take an example of the following connect string
TEST =
(DESCRIPTION =
(ADDRESS_LIST =
(LOAD_BALANCE = OFF)
(ADDRESS = (PROTOCOL = TCP)(HOST = sdby1-vip)(PORT = 1521))
(ADDRESS = (PROTOCOL = TCP)(HOST = sdby2-vip)(PORT = 1521))
(ADDRESS = (PROTOCOL = TCP)(HOST = sdby3-vip)(PORT = 1521))
(ADDRESS = (PROTOCOL = TCP)(HOST = sdby4-vip)(PORT = 1521))
(ADDRESS = (PROTOCOL = TCP)(HOST = prim1-vip)(PORT = 1521))
)
(CONNECT_DATA =
(SERVER = DEDICATED)
(SERVICE_NAME = TEST)
)
)
In the above alias the first 4 nodes are non existent nodes and the service TEST
runs on the node prim1 which is listed last in the above alias.
I have deliberately set load_balance to OFF so that the client has to traverse through all nodes serially.
If we set an OUTBOUND_CONNECT_TIMEOUT of 3 seconds in the client's sqlnet.ora
(client is 10.2.0.3 Solaris) then the time to establish the connection is around 12 seconds.
If we were to run a sqlnet trace on the connection we see that the connection starts at
Connection started at
[27-JAN-2009 22:52:33:741] --- TRACE CONFIGURATION INFORMATION FOLLOWS ---
[27-JAN-2009 22:52:33:741] New trace stream is /tmp/cli_262.trc
and the first address which is tried is
[27-JAN-2009 22:52:33:757] nsc2addr: (DESCRIPTION=(ADDRESS=(PROTOCOL=TCP)(HOST=sdb1-vip)(PORT=1521))(CONNECT_DATA=(SERVER=DEDICATED)(SERVICE_NAME=TEST)(CID=(PROGRAM=sqlplus@bart)(HOST=bart)(USER=oracle))))
Moving on we can see that OCT is enabled due to the line
[27-JAN-2009 22:52:33:759] nstoSetupTimeout: entry
[27-JAN-2009 22:52:33:759] nstoSetupTimeout: ATO enabled for ctx=0x1001c9280, val=3000(millisecs)
After this we the following pattern is seen continuously
[27-JAN-2009 22:52:33:776] nsevwtsg: entry
[27-JAN-2009 22:52:33:776] nsevwtsg: cid=0
[27-JAN-2009 22:52:33:776] nsevwait: entry
[27-JAN-2009 22:52:33:776] nsevwait: 1 registered connection(s)
[27-JAN-2009 22:52:33:776] nsevwait: 0 pre-posted event(s)
[27-JAN-2009 22:52:33:776] nsevwait: waiting for transport event (0 thru 0)...
[27-JAN-2009 22:52:33:776] nsevwait: 0 newly-posted event(s)
[27-JAN-2009 22:52:33:776] nsevwait: 0 posted event(s)
[27-JAN-2009 22:52:33:776] nsevwait: exit (0)
[27-JAN-2009 22:52:33:776] nstoToqCheckSingle: entry
[27-JAN-2009 22:52:33:776] nstoToqCheckSingle: normal exit
and the timeout occurs in 3 seconds
[27-JAN-2009 22:52:36:771] nstoHandleEventTO: ATO occurred for ctx=0x1001c9280
Ergo the OCT seems to be working perfectly
The client then tries to establish a connection with sdby2-vip and experiences
the same timeout
The connection is finally established at
[27-JAN-2009 22:52:45:915] nscon: no connect data
[27-JAN-2009 22:52:45:915] nscon: connect handshake is complete
[27-JAN-2009 22:52:45:915] nscon: nsctxinf[0]=0x41, [1]=0x41
[27-JAN-2009 22:52:45:915] nscon: normal exit
which translates to around 12 seconds.
From my testing for clients on Windows
OUTBOUND_CONNECT_TIMEOUT does not work with 10.2.0.3 base windows client. (Clients may get errors)
It works with patch 21 on top of 10.2.0.3
OUTBOUND_CONNECT_TIMEOUT does work with 11g client
Without OCT if we trace the connection again we see that we wait for more than 3 mins
[28-JAN-2009 14:18:35:299] nttcni: entry
[28-JAN-2009 14:18:35:299] nttcni: trying to connect to socket 10.
[28-JAN-2009 14:22:19:915] ntt2err: entry
[28-JAN-2009 14:22:19:915] ntt2err: soc 10 error - operation=1, ntresnt[0]=505, ntresnt[1]=145, ntresnt[2]=0
[28-JAN-2009 14:22:19:915] ntt2err: exit
[28-JAN-2009 14:22:19:915] nttcni: exit
[28-JAN-2009 14:22:19:915] nttcon: exit
[28-JAN-2009 14:22:19:921] nserror: entry
[28-JAN-2009 14:22:19:921] nserror: nsres: id=0, op=65, ns=12535, ns2=12560; nt[0]=505, nt[1]=145, nt[2]=0; ora[0]=0, ora[1]=0, ora[2]=0
[28-JAN-2009 14:22:19:921] nsopen: unable to open transport
[28-JAN-2009 14:22:19:921] nsiocancel: entry
In this post I will demonstrate how outbound_connect_timeout (OCT) can effectively avoid timeouts experienced by clients connecting to RAC nodes
If we take an example of the following connect string
TEST =
(DESCRIPTION =
(ADDRESS_LIST =
(LOAD_BALANCE = OFF)
(ADDRESS = (PROTOCOL = TCP)(HOST = sdby1-vip)(PORT = 1521))
(ADDRESS = (PROTOCOL = TCP)(HOST = sdby2-vip)(PORT = 1521))
(ADDRESS = (PROTOCOL = TCP)(HOST = sdby3-vip)(PORT = 1521))
(ADDRESS = (PROTOCOL = TCP)(HOST = sdby4-vip)(PORT = 1521))
(ADDRESS = (PROTOCOL = TCP)(HOST = prim1-vip)(PORT = 1521))
)
(CONNECT_DATA =
(SERVER = DEDICATED)
(SERVICE_NAME = TEST)
)
)
In the above alias the first 4 nodes are non existent nodes and the service TEST
runs on the node prim1 which is listed last in the above alias.
I have deliberately set load_balance to OFF so that the client has to traverse through all nodes serially.
If we set an OUTBOUND_CONNECT_TIMEOUT of 3 seconds in the client's sqlnet.ora
(client is 10.2.0.3 Solaris) then the time to establish the connection is around 12 seconds.
If we were to run a sqlnet trace on the connection we see that the connection starts at
Connection started at
[27-JAN-2009 22:52:33:741] --- TRACE CONFIGURATION INFORMATION FOLLOWS ---
[27-JAN-2009 22:52:33:741] New trace stream is /tmp/cli_262.trc
and the first address which is tried is
[27-JAN-2009 22:52:33:757] nsc2addr: (DESCRIPTION=(ADDRESS=(PROTOCOL=TCP)(HOST=sdb1-vip)(PORT=1521))(CONNECT_DATA=(SERVER=DEDICATED)(SERVICE_NAME=TEST)(CID=(PROGRAM=sqlplus@bart)(HOST=bart)(USER=oracle))))
Moving on we can see that OCT is enabled due to the line
[27-JAN-2009 22:52:33:759] nstoSetupTimeout: entry
[27-JAN-2009 22:52:33:759] nstoSetupTimeout: ATO enabled for ctx=0x1001c9280, val=3000(millisecs)
After this we the following pattern is seen continuously
[27-JAN-2009 22:52:33:776] nsevwtsg: entry
[27-JAN-2009 22:52:33:776] nsevwtsg: cid=0
[27-JAN-2009 22:52:33:776] nsevwait: entry
[27-JAN-2009 22:52:33:776] nsevwait: 1 registered connection(s)
[27-JAN-2009 22:52:33:776] nsevwait: 0 pre-posted event(s)
[27-JAN-2009 22:52:33:776] nsevwait: waiting for transport event (0 thru 0)...
[27-JAN-2009 22:52:33:776] nsevwait: 0 newly-posted event(s)
[27-JAN-2009 22:52:33:776] nsevwait: 0 posted event(s)
[27-JAN-2009 22:52:33:776] nsevwait: exit (0)
[27-JAN-2009 22:52:33:776] nstoToqCheckSingle: entry
[27-JAN-2009 22:52:33:776] nstoToqCheckSingle: normal exit
and the timeout occurs in 3 seconds
[27-JAN-2009 22:52:36:771] nstoHandleEventTO: ATO occurred for ctx=0x1001c9280
Ergo the OCT seems to be working perfectly
The client then tries to establish a connection with sdby2-vip and experiences
the same timeout
The connection is finally established at
[27-JAN-2009 22:52:45:915] nscon: no connect data
[27-JAN-2009 22:52:45:915] nscon: connect handshake is complete
[27-JAN-2009 22:52:45:915] nscon: nsctxinf[0]=0x41, [1]=0x41
[27-JAN-2009 22:52:45:915] nscon: normal exit
which translates to around 12 seconds.
From my testing for clients on Windows
OUTBOUND_CONNECT_TIMEOUT does not work with 10.2.0.3 base windows client. (Clients may get errors)
It works with patch 21 on top of 10.2.0.3
OUTBOUND_CONNECT_TIMEOUT does work with 11g client
Without OCT if we trace the connection again we see that we wait for more than 3 mins
[28-JAN-2009 14:18:35:299] nttcni: entry
[28-JAN-2009 14:18:35:299] nttcni: trying to connect to socket 10.
[28-JAN-2009 14:22:19:915] ntt2err: entry
[28-JAN-2009 14:22:19:915] ntt2err: soc 10 error - operation=1, ntresnt[0]=505, ntresnt[1]=145, ntresnt[2]=0
[28-JAN-2009 14:22:19:915] ntt2err: exit
[28-JAN-2009 14:22:19:915] nttcni: exit
[28-JAN-2009 14:22:19:915] nttcon: exit
[28-JAN-2009 14:22:19:921] nserror: entry
[28-JAN-2009 14:22:19:921] nserror: nsres: id=0, op=65, ns=12535, ns2=12560; nt[0]=505, nt[1]=145, nt[2]=0; ora[0]=0, ora[1]=0, ora[2]=0
[28-JAN-2009 14:22:19:921] nsopen: unable to open transport
[28-JAN-2009 14:22:19:921] nsiocancel: entry
Sunday, November 30, 2008
Parallel Rollback
I had a user call up and ask to kill a session which was causing him grief and hence I killed it without much thought since it was not a Production system
A few hours later I noticed that SMON was doing parallel txn recovery. This was validated by the view
select * from x$ktprxrt;
Unfortunately I have lost the output but it did show that it would take eons
But this was also confirmed from the pstack of smon which included the function ktprbeg which I believe begins parallel rollback. (Snippet below)
[syd0904:oracle:OSTA1]/u01/app/oracle => pstack 11905
11905: ora_smon_OSTA1
0000000100d80868 kturax (fffffffffffffffe, 380017150, b, 380017, 105ebe510, 5) + 928
0000000100e15620 ktprbeg (106502000, 0, 1065033c8, 105400, 1056b5, 1065033c8) + 1a0 ===> Begin parallel rollback
00000001007e9238 ktmmon (ffffffffffffffff, ffffffff7fffdda8, 0, 1056b5000, 1, 106502000) + f58
000000010106e0dc ksbrdp (105f1b000, 38000e, 106505ce0, 105f1b000, 105f1b, 1007e8260) + 39c
00000001024efed8 opirip (106510000, 106400, 106518, 380007000, 106510, 1066a5650) + 338
000000010033f7b4 opidrv (106512a90, 0, 32, 10650f7c8, 32, 0) + 4b4
0000000100339c50 sou2o (ffffffff7ffff3e8, 32, 4, ffffffff7ffff410, 105de9000, 105de9) + 50
00000001002fc00c opimai_real (3, ffffffff7ffff4e8, 0, 0, 247e09c, 14800) + 10c
00000001002fbe38 main (1, ffffffff7ffff5f8, 0, ffffffff7ffff4f0, ffffffff7ffff600, ffffffff79d00140) + 98
00000001002fbd5c _start (0, 0, 0, 0, 0, 0) + 17c
----------------- lwp# 2 / thread# 2 --------------------
and also confirmed from the SMON trace file
*** 2008-11-28 12:03:16.828
Parallel Transaction recovery caught exception 30319
Parallel Transaction recovery caught error 30319
*** 2008-11-28 12:07:17.163
Parallel Transaction recovery caught exception 30319
Parallel Transaction recovery caught error 30319
So the first thing I did was to disable parallel recovery because of the issue documented in Metalink
using
SQL> ALTER SYSTEM SET fast_start_parallel_rollback='FALSE';
System altered.
IMHO (atleast from past experience) serial recovery is faster than parallel recovery atleast in the case where the transaction causes a lot of index block splits.
After this the row from x$ktprxrt disappeared and the following appeared in the SMON trace file
*** 2008-11-28 12:08:32.763
SMON: parallel recovery restart with degree=0 (!=16)
Parallel Transaction recovery caught exception 30312
Parallel Transaction recovery caught error 30312
*** 2008-11-28 12:08:33.039
SMON: parallel recovery restart with degree=0 (!=16)
Parallel Transaction recovery caught exception 30312
Parallel Transaction recovery caught error 30312
The following views agree on how much time it is going to take to complete the rollback
SQL> select * from x$ktuxe where KTUXECFL='DEAD' and KTUXESTA='ACTIVE';
ADDR INDX INST_ID KTUXEUSN KTUXESLT KTUXESQN KTUXERDBF KTUXERDBB KTUXESCNB KTUXESCNW KTUXESTA
---------------- ---------- ---------- ---------- ---------- ---------- ---------- ---------- ---------- ---------- ----------------
KTUXECFL KTUXEUEL KTUXEDDBF KTUXEDDBB KTUXEPUSN KTUXEPSLT KTUXEPSQN KTUXESIZ
------------------------ ---------- ---------- ---------- ---------- ---------- ---------- ----------
FFFFFFFF79969D78 114 1 1 16 174276 2 36154 1113256061 1021 ACTIVE
DEAD 13 0 0 0 0 0 639787
SQL> select * from GV$FAST_START_TRANSACTIONS ;
INST_ID USN SLT SEQ STATE UNDOBLOCKSDONE UNDOBLOCKSTOTAL PID CPUTIME PARENTUSN PARENTSLT
---------- ---------- ---------- ---------- ---------------- -------------- --------------- ---------- ---------- ---------- ----------
PARENTSEQ XID PXID RCVSERVERS
---------- ---------------- ---------------- ----------
1 1 16 174276 RECOVERING 122712 762423 6312
000100100002A8C4 0
As you can see the value of
KTUXESIZ matches (UNDOBLOCKSTOTAL - UNDOBLOCKSDONE)
So rollback will complete when KTUXESIZ in x$ktuxe drops down to 0 which looks like alot of time !!!
Dumping the redo confirmed that it was the same transaction which was killed
Surprisingly the value of "rollback changes - undo records applied" in v$sysstat was not increasing during this timeline. I have tested this again (kill a long running job and watch the rollback) and can confirm that the stat does get incremented.
A few hours later I noticed that SMON was doing parallel txn recovery. This was validated by the view
select * from x$ktprxrt;
Unfortunately I have lost the output but it did show that it would take eons
But this was also confirmed from the pstack of smon which included the function ktprbeg which I believe begins parallel rollback. (Snippet below)
[syd0904:oracle:OSTA1]/u01/app/oracle => pstack 11905
11905: ora_smon_OSTA1
0000000100d80868 kturax (fffffffffffffffe, 380017150, b, 380017, 105ebe510, 5) + 928
0000000100e15620 ktprbeg (106502000, 0, 1065033c8, 105400, 1056b5, 1065033c8) + 1a0 ===> Begin parallel rollback
00000001007e9238 ktmmon (ffffffffffffffff, ffffffff7fffdda8, 0, 1056b5000, 1, 106502000) + f58
000000010106e0dc ksbrdp (105f1b000, 38000e, 106505ce0, 105f1b000, 105f1b, 1007e8260) + 39c
00000001024efed8 opirip (106510000, 106400, 106518, 380007000, 106510, 1066a5650) + 338
000000010033f7b4 opidrv (106512a90, 0, 32, 10650f7c8, 32, 0) + 4b4
0000000100339c50 sou2o (ffffffff7ffff3e8, 32, 4, ffffffff7ffff410, 105de9000, 105de9) + 50
00000001002fc00c opimai_real (3, ffffffff7ffff4e8, 0, 0, 247e09c, 14800) + 10c
00000001002fbe38 main (1, ffffffff7ffff5f8, 0, ffffffff7ffff4f0, ffffffff7ffff600, ffffffff79d00140) + 98
00000001002fbd5c _start (0, 0, 0, 0, 0, 0) + 17c
----------------- lwp# 2 / thread# 2 --------------------
and also confirmed from the SMON trace file
*** 2008-11-28 12:03:16.828
Parallel Transaction recovery caught exception 30319
Parallel Transaction recovery caught error 30319
*** 2008-11-28 12:07:17.163
Parallel Transaction recovery caught exception 30319
Parallel Transaction recovery caught error 30319
So the first thing I did was to disable parallel recovery because of the issue documented in Metalink
using
SQL> ALTER SYSTEM SET fast_start_parallel_rollback='FALSE';
System altered.
IMHO (atleast from past experience) serial recovery is faster than parallel recovery atleast in the case where the transaction causes a lot of index block splits.
After this the row from x$ktprxrt disappeared and the following appeared in the SMON trace file
*** 2008-11-28 12:08:32.763
SMON: parallel recovery restart with degree=0 (!=16)
Parallel Transaction recovery caught exception 30312
Parallel Transaction recovery caught error 30312
*** 2008-11-28 12:08:33.039
SMON: parallel recovery restart with degree=0 (!=16)
Parallel Transaction recovery caught exception 30312
Parallel Transaction recovery caught error 30312
The following views agree on how much time it is going to take to complete the rollback
SQL> select * from x$ktuxe where KTUXECFL='DEAD' and KTUXESTA='ACTIVE';
ADDR INDX INST_ID KTUXEUSN KTUXESLT KTUXESQN KTUXERDBF KTUXERDBB KTUXESCNB KTUXESCNW KTUXESTA
---------------- ---------- ---------- ---------- ---------- ---------- ---------- ---------- ---------- ---------- ----------------
KTUXECFL KTUXEUEL KTUXEDDBF KTUXEDDBB KTUXEPUSN KTUXEPSLT KTUXEPSQN KTUXESIZ
------------------------ ---------- ---------- ---------- ---------- ---------- ---------- ----------
FFFFFFFF79969D78 114 1 1 16 174276 2 36154 1113256061 1021 ACTIVE
DEAD 13 0 0 0 0 0 639787
SQL> select * from GV$FAST_START_TRANSACTIONS ;
INST_ID USN SLT SEQ STATE UNDOBLOCKSDONE UNDOBLOCKSTOTAL PID CPUTIME PARENTUSN PARENTSLT
---------- ---------- ---------- ---------- ---------------- -------------- --------------- ---------- ---------- ---------- ----------
PARENTSEQ XID PXID RCVSERVERS
---------- ---------------- ---------------- ----------
1 1 16 174276 RECOVERING 122712 762423 6312
000100100002A8C4 0
As you can see the value of
KTUXESIZ matches (UNDOBLOCKSTOTAL - UNDOBLOCKSDONE)
So rollback will complete when KTUXESIZ in x$ktuxe drops down to 0 which looks like alot of time !!!
Dumping the redo confirmed that it was the same transaction which was killed
Surprisingly the value of "rollback changes - undo records applied" in v$sysstat was not increasing during this timeline. I have tested this again (kill a long running job and watch the rollback) and can confirm that the stat does get incremented.
Wednesday, July 30, 2008
11g SQLNet Client trace files
I spent half an hour wondering why I was not able to generate a SQL* Net client trace file from a 11g client to a 10.2 database.
Here are the contents of my client sqlnet.ora
bart:ELEV:/opt/oracle/product/11.1.0/db_1/network/admin> cat sqlnet.ora
#SQLNET.OUTBOUND_CONNECT_TIMEOUT = 3
TRACE_LEVEL_CLIENT= 16
TRACE_DIRECTORY_CLIENT = /tmp
TRACE_FILE_CLIENT= cli.trc
TRACE_TIMESTAMP_CLIENT = ON
TRACE_UNIQUE_CLIENT = ON
It took me a while to realize that thanks to ADR the client trace files were actually going to $ORACLE_BASE/diag/clients/user_oracle/host_xxx/trace
The only way to disable this is to add the following in the sqlnet.ora
DIAG_ADR_ENABLED=off
After setting the above line in the sqlnet.ora the client trace files were generated in /tmp
Here are the contents of my client sqlnet.ora
bart:ELEV:/opt/oracle/product/11.1.0/db_1/network/admin> cat sqlnet.ora
#SQLNET.OUTBOUND_CONNECT_TIMEOUT = 3
TRACE_LEVEL_CLIENT= 16
TRACE_DIRECTORY_CLIENT = /tmp
TRACE_FILE_CLIENT= cli.trc
TRACE_TIMESTAMP_CLIENT = ON
TRACE_UNIQUE_CLIENT = ON
It took me a while to realize that thanks to ADR the client trace files were actually going to $ORACLE_BASE/diag/clients/user_oracle/host_xxx/trace
The only way to disable this is to add the following in the sqlnet.ora
DIAG_ADR_ENABLED=off
After setting the above line in the sqlnet.ora the client trace files were generated in /tmp
Monday, July 28, 2008
One off patches, conflicts and merges
So you are applying one of the zillion patches on top of 10.2.0.3 and you hit the following error
************************************************************************
ApplySession applying interim patch '6338357' to OH
'/opt/oracle/product/10.2.0/db_1'
Interim patch 6338357 has File Conflict with patch(es) [ 5399670 ]
in OH /opt/oracle/product/10.2.0/db_1
************************************************************************
Wouldn't it be nice if you could check for conflicts before you apply a patch
Here is one way to do the same
1. You can check which source code file is being modified by doing the following
cd 6338357/etc/config
cat actions | grep .o
oneoff_actions
oracle.rdbms version="10.2.0.3.0" opt_req="R"
archive name="libserver10.a" path="%ORACLE_HOME%/lib" object_name="lib/libserver10.a/kelt.o"
make change_dir="%ORACLE_HOME%/rdbms/lib" make_file="ins_rdbms.mk" make_target="ioracle"
oracle.rdbms
oneoff_actions
2. Then go to the $ORACLE_HOME/.patch_storage and see if any of the previous patches have modified the same file
bart:TEST:/opt/oracle/product/10.2.0/db_1/.patch_storage> find . -name 'kelt.o' -print
./verify/archive/lib/libserver10.a/kelt.o
./5399670_Mar_20_2008_20_30_34/backup/.patch_storage/5399670_Mar_20_2008_20_30_34/files/lib/libserver10.a/kelt.o
./5399670_Mar_20_2008_20_30_34/original_patch/files/lib/libserver10.a/kelt.o
./5399670_Mar_20_2008_20_30_34/scratch/kelt.o./5399670_Mar_20_2008_20_30_34/files/lib/libserver10.a/kelt.o
So this clearly shows that Patch 5399670 was previously applied which modified the same source code file and you need a merge patch for both bugs (5399670 and 6338357)
************************************************************************
ApplySession applying interim patch '6338357' to OH
'/opt/oracle/product/10.2.0/db_1'
Interim patch 6338357 has File Conflict with patch(es) [ 5399670 ]
in OH /opt/oracle/product/10.2.0/db_1
************************************************************************
Wouldn't it be nice if you could check for conflicts before you apply a patch
Here is one way to do the same
1. You can check which source code file is being modified by doing the following
cd 6338357/etc/config
cat actions | grep .o
oneoff_actions
oracle.rdbms version="10.2.0.3.0" opt_req="R"
archive name="libserver10.a" path="%ORACLE_HOME%/lib" object_name="lib/libserver10.a/kelt.o"
make change_dir="%ORACLE_HOME%/rdbms/lib" make_file="ins_rdbms.mk" make_target="ioracle"
oracle.rdbms
oneoff_actions
2. Then go to the $ORACLE_HOME/.patch_storage and see if any of the previous patches have modified the same file
bart:TEST:/opt/oracle/product/10.2.0/db_1/.patch_storage> find . -name 'kelt.o' -print
./verify/archive/lib/libserver10.a/kelt.o
./5399670_Mar_20_2008_20_30_34/backup/.patch_storage/5399670_Mar_20_2008_20_30_34/files/lib/libserver10.a/kelt.o
./5399670_Mar_20_2008_20_30_34/original_patch/files/lib/libserver10.a/kelt.o
./5399670_Mar_20_2008_20_30_34/scratch/kelt.o./5399670_Mar_20_2008_20_30_34/files/lib/libserver10.a/kelt.o
So this clearly shows that Patch 5399670 was previously applied which modified the same source code file and you need a merge patch for both bugs (5399670 and 6338357)
Monday, February 04, 2008
Rolling invalidations Addendum
If you enable cursor trace for the testcase in my previous post using the method described in http://el-caro.blogspot.com/search?q=unshared
The generated trace in udump will have the following
************************************************************
kksCheckCursor: pinning child #0 in shared mode 7d42bd0e8 7d7e87600
Failed sharing : Rolling invalidation
kksUnlockChild: releasing child
Failed sharing : 800000000000
kksSearchChildList: no suitable child found
Creating new child object #1
kksLoadChild: reload 0 child_reload 0
kksLoadChild: reload 0 child_reload 0
Compilation environment difference Failed sharing : 0
Change in cursor environment
************************************************************
Also the parameter _optimizer_invalidation_period does not work for statements using PQ. This can be tested by changing the degree of the table to 4 (say) and running the same test. In this case a new child cursor is generated on the first re-execution of the statement after stats are gathered even when the auto_invalidate flag is used.
The generated trace in udump will have the following
************************************************************
kksCheckCursor: pinning child #0 in shared mode 7d42bd0e8 7d7e87600
Failed sharing : Rolling invalidation
kksUnlockChild: releasing child
Failed sharing : 800000000000
kksSearchChildList: no suitable child found
Creating new child object #1
kksLoadChild: reload 0 child_reload 0
kksLoadChild: reload 0 child_reload 0
Compilation environment difference Failed sharing : 0
Change in cursor environment
************************************************************
Also the parameter _optimizer_invalidation_period does not work for statements using PQ. This can be tested by changing the degree of the table to 4 (say) and running the same test. In this case a new child cursor is generated on the first re-execution of the statement after stats are gathered even when the auto_invalidate flag is used.
Wednesday, January 30, 2008
Rolling invalidations
There have been discussions which I have seen related to the feature of auto invalidation in dbms_stats. A couple of references are
http://forums.oracle.com/forums/thread.jspa?threadID=592771&tstart=30
and
http://www.orafaq.com/maillist/oracle-l/2006/10/10/0429.htm
I have tested the relevant parameter “_optimizer_invalidation_period” on 10.2.0.3 and believe that this is working as expected
Let us take the below testcase where the parameter (it is dynamic) is set to a value of 120
SQL> show parameter optimizer_inva
NAME TYPE VALUE
------------------------------------ ----------- ------------------------------
_optimizer_invalidation_period integer 120
We have the following sql statement
11:00:00 SQL> select * from source where rownum<2;
OBJ# LINE SOURCE
---------- ---------- ---------------------------------------------------------------------------
194107 171 -- *Action: Start a new job, or attach to an existing job that has a
1 row selected.
Elapsed: 00:00:00.12
11:00:00 SQL> select * from source where rownum<2;
OBJ# LINE SOURCE
---------- ---------- ---------------------------------------------------------------------------
194107 171 -- *Action: Start a new job, or attach to an existing job that has a
1 row selected.
Elapsed: 00:00:00.00
11:00:00 SQL> select a.child_number,LAST_LOAD_TIME, to_char(LAST_ACTIVE_TIME,'dd-mon-yyyy hh24:mi:ss') ,b.invalidations from
v$SQL_SHARED_CURSOR a, v$sql b where a.sql_id='954g5yyw5tn1s' and a.child_address=b.child_address ;
CHILD_NUMBER LAST_LOAD_TIME TO_CHAR(LAST_ACTIVE_ INVALIDATIONS
------------ ------------------- -------------------- -------------
0 2008-01-29/11:00:00 29-jan-2008 11:00:00 0
1 row selected.
Elapsed: 00:00:00.14
11:00:00 SQL>
11:00:00 SQL> select executions, invalidations,child_number from v$sql where sql_id='954g5yyw5tn1s';
EXECUTIONS INVALIDATIONS CHILD_NUMBER
---------- ------------- ------------
2 0 0
1 row selected.
Now we gather stats on the table with the auto_invalidate parameter passed to the API.
11:00:00 SQL> exec dbms_stats.gather_table_stats('REGOFA','SOURCE',no_invalidate => DBMS_STATS.AUTO_INVALIDATE);
PL/SQL procedure successfully completed.
Elapsed: 00:00:01.50
Then we keep executing the sql statement of interest to check when the new cursor will be generated.
Elapsed: 00:00:01.50
11:00:13 SQL> select a.child_number,LAST_LOAD_TIME, to_char(LAST_ACTIVE_TIME,'dd-mon-yyyy hh24:mi:ss') ,b.invalidations from
v$SQL_SHARED_CURSOR a, v$sql b where a.sql_id='954g5yyw5tn1s' and a.child_address=b.child_address ;
CHILD_NUMBER LAST_LOAD_TIME TO_CHAR(LAST_ACTIVE_ INVALIDATIONS
------------ ------------------- -------------------- -------------
0 2008-01-29/11:00:00 29-jan-2008 11:00:09 0
1 row selected.
Elapsed: 00:00:00.05
11:00:13 SQL> select executions, invalidations,child_number from v$sql where sql_id='954g5yyw5tn1s';
EXECUTIONS INVALIDATIONS CHILD_NUMBER
---------- ------------- ------------
3 0 0
1 row selected.
Elapsed: 00:00:00.00
11:00:13 SQL> select * from v$sql_shared_cursor where sql_id='954g5yyw5tn1s';
SQL_ID ADDRESS CHILD_ADDRESS CHILD_NUMBER U S O O S L S E B P
------------- ---------------- ---------------- ------------ - - - - - - - - - -
I S T A B D L T R I I R L I O S M U T N F A I T D L D B P C S R P T M B M R O P
- - - - - - - - - - - - - - - - - - - - - - - - - - - - - - - - - - - - - - - -
M F L
- - -
954g5yyw5tn1s 00000007D3BBCBD8 00000007D5644028 0 N N N N N N N N N N
N N N N N N N N N N N N N N N N N N N N N N N N N N N N N N N N N N N N N N N N
N N N
1 row selected.
…….
11:00:37 SQL> select * from source where rownum<2;
OBJ# LINE SOURCE
---------- ---------- ---------------------------------------------------------------------------
194107 171 -- *Action: Start a new job, or attach to an existing job that has a
1 row selected.
Elapsed: 00:00:00.01
11:00:39 SQL> select a.child_number,LAST_LOAD_TIME, to_char(LAST_ACTIVE_TIME,'dd-mon-yyyy hh24:mi:ss') ,b.invalidations from
v$SQL_SHARED_CURSOR a, v$sql b where a.sql_id='954g5yyw5tn1s' and a.child_address=b.child_address ;
CHILD_NUMBER LAST_LOAD_TIME TO_CHAR(LAST_ACTIVE_ INVALIDATIONS
------------ ------------------- -------------------- -------------
0 2008-01-29/11:00:00 29-jan-2008 11:00:25 0
1 2008-01-29/11:00:37 29-jan-2008 11:00:37 0
2 rows selected.
Elapsed: 00:00:00.04
11:00:39 SQL> select executions, invalidations,child_number from v$sql where sql_id='954g5yyw5tn1s';
EXECUTIONS INVALIDATIONS CHILD_NUMBER
---------- ------------- ------------
7 0 0
1 0 1
2 rows selected.
Elapsed: 00:00:00.00
11:00:39 SQL> select * from v$sql_shared_cursor where sql_id='954g5yyw5tn1s';
SQL_ID ADDRESS CHILD_ADDRESS CHILD_NUMBER U S O O S L S E B P
------------- ---------------- ---------------- ------------ - - - - - - - - - -
I S T A B D L T R I I R L I O S M U T N F A I T D L D B P C S R P T M B M R O P
- - - - - - - - - - - - - - - - - - - - - - - - - - - - - - - - - - - - - - - -
M F L
- - -
954g5yyw5tn1s 00000007D3BBCBD8 00000007D5644028 0 N N N N N N N N N N
N N N N N N N N N N N N N N N N N N N N N N N N N N N N N N N N N N N N N N N N
N N N
954g5yyw5tn1s 00000007D3BBCBD8 00000007D3753DC0 1 N N N N N N N N N N
N N N N N N N N N N N N N N N N N N N N N N N N N N N N N N N N N N N N N Y N N
N N N
So somewhere between 11:00:00 and 11:00:39 (within the 2 minute window) a new child cursor has been generated with roll_invalid_mismatch set to ‘Y”
I have tested for the following values of _optimizer_invalidation_period and I see consistent results
120
210
600
1800
18000
Hence this would be an ideal way to avoid a hard parse storm
http://forums.oracle.com/forums/thread.jspa?threadID=592771&tstart=30
and
http://www.orafaq.com/maillist/oracle-l/2006/10/10/0429.htm
I have tested the relevant parameter “_optimizer_invalidation_period” on 10.2.0.3 and believe that this is working as expected
Let us take the below testcase where the parameter (it is dynamic) is set to a value of 120
SQL> show parameter optimizer_inva
NAME TYPE VALUE
------------------------------------ ----------- ------------------------------
_optimizer_invalidation_period integer 120
We have the following sql statement
11:00:00 SQL> select * from source where rownum<2;
OBJ# LINE SOURCE
---------- ---------- ---------------------------------------------------------------------------
194107 171 -- *Action: Start a new job, or attach to an existing job that has a
1 row selected.
Elapsed: 00:00:00.12
11:00:00 SQL> select * from source where rownum<2;
OBJ# LINE SOURCE
---------- ---------- ---------------------------------------------------------------------------
194107 171 -- *Action: Start a new job, or attach to an existing job that has a
1 row selected.
Elapsed: 00:00:00.00
11:00:00 SQL> select a.child_number,LAST_LOAD_TIME, to_char(LAST_ACTIVE_TIME,'dd-mon-yyyy hh24:mi:ss') ,b.invalidations from
v$SQL_SHARED_CURSOR a, v$sql b where a.sql_id='954g5yyw5tn1s' and a.child_address=b.child_address ;
CHILD_NUMBER LAST_LOAD_TIME TO_CHAR(LAST_ACTIVE_ INVALIDATIONS
------------ ------------------- -------------------- -------------
0 2008-01-29/11:00:00 29-jan-2008 11:00:00 0
1 row selected.
Elapsed: 00:00:00.14
11:00:00 SQL>
11:00:00 SQL> select executions, invalidations,child_number from v$sql where sql_id='954g5yyw5tn1s';
EXECUTIONS INVALIDATIONS CHILD_NUMBER
---------- ------------- ------------
2 0 0
1 row selected.
Now we gather stats on the table with the auto_invalidate parameter passed to the API.
11:00:00 SQL> exec dbms_stats.gather_table_stats('REGOFA','SOURCE',no_invalidate => DBMS_STATS.AUTO_INVALIDATE);
PL/SQL procedure successfully completed.
Elapsed: 00:00:01.50
Then we keep executing the sql statement of interest to check when the new cursor will be generated.
Elapsed: 00:00:01.50
11:00:13 SQL> select a.child_number,LAST_LOAD_TIME, to_char(LAST_ACTIVE_TIME,'dd-mon-yyyy hh24:mi:ss') ,b.invalidations from
v$SQL_SHARED_CURSOR a, v$sql b where a.sql_id='954g5yyw5tn1s' and a.child_address=b.child_address ;
CHILD_NUMBER LAST_LOAD_TIME TO_CHAR(LAST_ACTIVE_ INVALIDATIONS
------------ ------------------- -------------------- -------------
0 2008-01-29/11:00:00 29-jan-2008 11:00:09 0
1 row selected.
Elapsed: 00:00:00.05
11:00:13 SQL> select executions, invalidations,child_number from v$sql where sql_id='954g5yyw5tn1s';
EXECUTIONS INVALIDATIONS CHILD_NUMBER
---------- ------------- ------------
3 0 0
1 row selected.
Elapsed: 00:00:00.00
11:00:13 SQL> select * from v$sql_shared_cursor where sql_id='954g5yyw5tn1s';
SQL_ID ADDRESS CHILD_ADDRESS CHILD_NUMBER U S O O S L S E B P
------------- ---------------- ---------------- ------------ - - - - - - - - - -
I S T A B D L T R I I R L I O S M U T N F A I T D L D B P C S R P T M B M R O P
- - - - - - - - - - - - - - - - - - - - - - - - - - - - - - - - - - - - - - - -
M F L
- - -
954g5yyw5tn1s 00000007D3BBCBD8 00000007D5644028 0 N N N N N N N N N N
N N N N N N N N N N N N N N N N N N N N N N N N N N N N N N N N N N N N N N N N
N N N
1 row selected.
…….
11:00:37 SQL> select * from source where rownum<2;
OBJ# LINE SOURCE
---------- ---------- ---------------------------------------------------------------------------
194107 171 -- *Action: Start a new job, or attach to an existing job that has a
1 row selected.
Elapsed: 00:00:00.01
11:00:39 SQL> select a.child_number,LAST_LOAD_TIME, to_char(LAST_ACTIVE_TIME,'dd-mon-yyyy hh24:mi:ss') ,b.invalidations from
v$SQL_SHARED_CURSOR a, v$sql b where a.sql_id='954g5yyw5tn1s' and a.child_address=b.child_address ;
CHILD_NUMBER LAST_LOAD_TIME TO_CHAR(LAST_ACTIVE_ INVALIDATIONS
------------ ------------------- -------------------- -------------
0 2008-01-29/11:00:00 29-jan-2008 11:00:25 0
1 2008-01-29/11:00:37 29-jan-2008 11:00:37 0
2 rows selected.
Elapsed: 00:00:00.04
11:00:39 SQL> select executions, invalidations,child_number from v$sql where sql_id='954g5yyw5tn1s';
EXECUTIONS INVALIDATIONS CHILD_NUMBER
---------- ------------- ------------
7 0 0
1 0 1
2 rows selected.
Elapsed: 00:00:00.00
11:00:39 SQL> select * from v$sql_shared_cursor where sql_id='954g5yyw5tn1s';
SQL_ID ADDRESS CHILD_ADDRESS CHILD_NUMBER U S O O S L S E B P
------------- ---------------- ---------------- ------------ - - - - - - - - - -
I S T A B D L T R I I R L I O S M U T N F A I T D L D B P C S R P T M B M R O P
- - - - - - - - - - - - - - - - - - - - - - - - - - - - - - - - - - - - - - - -
M F L
- - -
954g5yyw5tn1s 00000007D3BBCBD8 00000007D5644028 0 N N N N N N N N N N
N N N N N N N N N N N N N N N N N N N N N N N N N N N N N N N N N N N N N N N N
N N N
954g5yyw5tn1s 00000007D3BBCBD8 00000007D3753DC0 1 N N N N N N N N N N
N N N N N N N N N N N N N N N N N N N N N N N N N N N N N N N N N N N N N Y N N
N N N
So somewhere between 11:00:00 and 11:00:39 (within the 2 minute window) a new child cursor has been generated with roll_invalid_mismatch set to ‘Y”
I have tested for the following values of _optimizer_invalidation_period and I see consistent results
120
210
600
1800
18000
Hence this would be an ideal way to avoid a hard parse storm
Tuesday, November 06, 2007
OCR Mirroring
In my last blog I talked about adding mirrors to your voting disk. Here I will document how to add mirrors to your OCR on a clustered file system like vxfs.
In the existing configuration there is only one ocr. The location of your ocr is specified in /var/opt/oracle/ocr.loc (on Solaris). It would be different depending on your port.
You need to add an OCR mirror when CRS is up else you get an error message like the one below
root@bart # /u01/app/oracle/product/10.1.0/crs/bin/ocrconfig -replace ocrmirror /u02/oracrs/ocr_file_02
PROT-1: Failed to initialize ocrconfig
For more details on why you have received an error check the latest ocrconfig log file under $ORA_CRS_HOME/log/node/client
root@bart # cat ocrconfig_1742.log
Oracle Database 10g CRS Release 10.2.0.1.0 Production Copyright 1996, 2005 Oracle. All rights reserved.
2007-10-27 12:32:19.130: [ OCRCONF][1]ocrconfig starts...
2007-10-27 12:32:20.933: [ OCRCONF][1]Failure in initializing ocr in DEFAULT level. error:[PROC-32: Cluster Ready Services on the local node i
s not running Messaging error [9]]
2007-10-27 12:32:20.933: [ OCRCONF][1]Exiting [status=failed]...
From the above error message it is clear that CRS needs to be up.
So after starting up CRS
root@bart # /u01/app/oracle/product/10.1.0/crs/bin/ocrconfig -replace ocrmirror /u02/oracrs/ocr_file_02
PROT-16: Internal Error
But even though I get an error it appears to have created the mirror
root@bart # cat /var/opt/oracle/ocr.loc
#Device/file getting replaced by device
/u02/oracrs/ocr_file_02
ocrconfig_loc=/u02/oracrs/ocr.dbf
ocrmirrorconfig_loc=/u02/oracrs/ocr_file_02
local_only=falseroot@bart
# ocrcheck
Status of Oracle Cluster Registry is as follows :
Version : 2
Total space (kbytes) : 262120
Used space (kbytes) : 24932
Available space (kbytes) : 237188
ID : 1909893349
Device/File Name : /u02/oracrs/ocr.dbf
Device/File integrity check succeeded
Device/File Name : /u02/oracrs/ocr_file_02
Device/File integrity check succeeded
Now let us replace the existing OCR with a new one file
u01/app/oracle/product/10.1.0/crs/bin/ocrconfig -replace ocr /u02/oracrs/ocr_file_01
PROT-16: Internal Error
root@bart # cat /var/opt/oracle/ocr.loc
#Device/file /u02/oracrs/ocr.dbf getting replaced by device
/u02/oracrs/ocr_file_01
ocrconfig_loc=/u02/oracrs/ocr_file_01
ocrmirrorconfig_loc=/u02/oracrs/ocr_file_02
local_only=falseroot@bart
# ocrcheck
Status of Oracle Cluster Registry is as follows :
Version : 2
Total space (kbytes) : 262120
Used space (kbytes) : 24932
Available space (kbytes) : 237188
ID : 1909893349
Device/File Name : /u02/oracrs/ocr_file_01
Device/File integrity check succeeded
Device/File Name : /u02/oracrs/ocr_file_02
Device/File integrity check succeeded
Cluster registry integrity check succeeded
At this point you can shutdown and startup CRS and see if all is fine. One point to note is that you should check that the ocr.loc files on all remote nodes are updated with the updated location of the OCR file. In my testing the CRS stack on the remote node was down and in such cases the ocr.loc on the remote node does not get updated.
When the cluster is running if the OCR mirror is removed/corrupted the cluster continues running and all crs commands including ocrcheck can be run if you comment the following line from /var/opt/oracle/ocr.loc
ocrmirrorconfig_loc=/u02/oracrs/ocr_file_02
If you lose the primary OCR the cluster keeps running but
ocrcheck fails and CRS cannot be stopped even if you comment out the following line even though the mirror is available.
root@bart # cat /var/opt/oracle/ocr.loc
#Device/file /u02/oracrs/ocr_file_01 getting replaced by device /u02/oracrs/ocr_file_01
#ocrconfig_loc=/u02/oracrs/ocr_file_01
ocrmirrorconfig_loc=/u02/oracrs/ocr_file_02
Things are fine if I replace the ocr using
root@bart # /u01/app/oracle/product/10.1.0/crs/bin/ocrconfig -replace ocr /u02/oracrs/ocr_file_01
PROT-16: Internal Error
In the existing configuration there is only one ocr. The location of your ocr is specified in /var/opt/oracle/ocr.loc (on Solaris). It would be different depending on your port.
You need to add an OCR mirror when CRS is up else you get an error message like the one below
root@bart # /u01/app/oracle/product/10.1.0/crs/bin/ocrconfig -replace ocrmirror /u02/oracrs/ocr_file_02
PROT-1: Failed to initialize ocrconfig
For more details on why you have received an error check the latest ocrconfig log file under $ORA_CRS_HOME/log/node/client
root@bart # cat ocrconfig_1742.log
Oracle Database 10g CRS Release 10.2.0.1.0 Production Copyright 1996, 2005 Oracle. All rights reserved.
2007-10-27 12:32:19.130: [ OCRCONF][1]ocrconfig starts...
2007-10-27 12:32:20.933: [ OCRCONF][1]Failure in initializing ocr in DEFAULT level. error:[PROC-32: Cluster Ready Services on the local node i
s not running Messaging error [9]]
2007-10-27 12:32:20.933: [ OCRCONF][1]Exiting [status=failed]...
From the above error message it is clear that CRS needs to be up.
So after starting up CRS
root@bart # /u01/app/oracle/product/10.1.0/crs/bin/ocrconfig -replace ocrmirror /u02/oracrs/ocr_file_02
PROT-16: Internal Error
But even though I get an error it appears to have created the mirror
root@bart # cat /var/opt/oracle/ocr.loc
#Device/file getting replaced by device
/u02/oracrs/ocr_file_02
ocrconfig_loc=/u02/oracrs/ocr.dbf
ocrmirrorconfig_loc=/u02/oracrs/ocr_file_02
local_only=falseroot@bart
# ocrcheck
Status of Oracle Cluster Registry is as follows :
Version : 2
Total space (kbytes) : 262120
Used space (kbytes) : 24932
Available space (kbytes) : 237188
ID : 1909893349
Device/File Name : /u02/oracrs/ocr.dbf
Device/File integrity check succeeded
Device/File Name : /u02/oracrs/ocr_file_02
Device/File integrity check succeeded
Now let us replace the existing OCR with a new one file
u01/app/oracle/product/10.1.0/crs/bin/ocrconfig -replace ocr /u02/oracrs/ocr_file_01
PROT-16: Internal Error
root@bart # cat /var/opt/oracle/ocr.loc
#Device/file /u02/oracrs/ocr.dbf getting replaced by device
/u02/oracrs/ocr_file_01
ocrconfig_loc=/u02/oracrs/ocr_file_01
ocrmirrorconfig_loc=/u02/oracrs/ocr_file_02
local_only=falseroot@bart
# ocrcheck
Status of Oracle Cluster Registry is as follows :
Version : 2
Total space (kbytes) : 262120
Used space (kbytes) : 24932
Available space (kbytes) : 237188
ID : 1909893349
Device/File Name : /u02/oracrs/ocr_file_01
Device/File integrity check succeeded
Device/File Name : /u02/oracrs/ocr_file_02
Device/File integrity check succeeded
Cluster registry integrity check succeeded
At this point you can shutdown and startup CRS and see if all is fine. One point to note is that you should check that the ocr.loc files on all remote nodes are updated with the updated location of the OCR file. In my testing the CRS stack on the remote node was down and in such cases the ocr.loc on the remote node does not get updated.
When the cluster is running if the OCR mirror is removed/corrupted the cluster continues running and all crs commands including ocrcheck can be run if you comment the following line from /var/opt/oracle/ocr.loc
ocrmirrorconfig_loc=/u02/oracrs/ocr_file_02
If you lose the primary OCR the cluster keeps running but
ocrcheck fails and CRS cannot be stopped even if you comment out the following line even though the mirror is available.
root@bart # cat /var/opt/oracle/ocr.loc
#Device/file /u02/oracrs/ocr_file_01 getting replaced by device /u02/oracrs/ocr_file_01
#ocrconfig_loc=/u02/oracrs/ocr_file_01
ocrmirrorconfig_loc=/u02/oracrs/ocr_file_02
Things are fine if I replace the ocr using
root@bart # /u01/app/oracle/product/10.1.0/crs/bin/ocrconfig -replace ocr /u02/oracrs/ocr_file_01
PROT-16: Internal Error
Saturday, November 03, 2007
Voting disk mirroring
A while ago I had blogged on how to add a voting disk to an existing RAC setup here.
To be safe it is best to do this with the cluster down.
I did the same recently on a 2 node RAC on 10.2.0.3 running Veritas SFRAC 4.1.
In the setup I am working on there is only one voting disk the location of which is
root@bart # /u01/app/oracle/product/10.1.0/crs/bin/crsctl query css votedisk
0. 0 /u02/oravoting/voting
With CRS down on all nodes you have to use the force option else you receive an error
root@bart # /u01/app/oracle/product/10.1.0/crs/bin/crsctl add css votedisk /u02/oravoting/voting_disk_01
Cluster is not in a ready state for online disk addition
root@bart # /u01/app/oracle/product/10.1.0/crs/bin/crsctl add css votedisk /u02/oravoting/voting_disk_01 -force
Now formatting voting disk: /u02/oravoting/voting_disk_01
CLSFMT returned with error [4].
failed 9 to initailize votedisk /u02/oravoting/voting_disk_01
root@bart # cd /u02/oravoting/
root@bart # ls -ltr
total 99992
-rw-r--r-- 1 oracle oinstall 10238976 Oct 30 11:53 voting
-rw-r--r-- 1 root other 10240000 Oct 30 12:05 voting_disk_01
So although it has created a second voting disk it has been created with the wrong permissions. When you do a fresh install of CRS the rootconfig script called from root.sh sets the owner of the voting disk to the owner of the crs software (in this case oracle). Hence this is a bug and the startup of css fails and you will see errors in the Unix logfile since the permissions are incorrect.
Lets’ add a second one..
root@bart # /u01/app/oracle/product/10.1.0/crs/bin/crsctl add css votedisk /u02/oravoting/voting_disk_02 -force
Now formatting voting disk: /u02/oravoting/voting_disk_02
CLSFMT returned with error [4].
failed 9 to initailize votedisk /u02/oravoting/voting_disk_02
If we do not change permissions of the second mirror css will startup (since we have 2 voting disks online and the algorithm requires that a majority of disks to be available) but the following message will be logged in the ocssd.log file
[ CSSD]2007-11-01 11:46:26.400 [1] >TRACE: clssnmDiskStateChange: state from 1 to 2 disk (0//u02/oravoting/voting)
[ CSSD]2007-11-01 11:46:26.401 [6] >TRACE: clssnmvDPT: spawned for disk 0
(/u02/oravoting/voting)
[ CSSD]2007-11-01 11:46:26.402 [1] >TRACE: clssnmDiskStateChange: state from 1 to 2 disk
(1//u02/oravoting/voting_disk_01
)
[ CSSD]2007-11-01 11:46:26.402 [7] >TRACE: clssnmvDPT: spawned for disk 1 (/u02/oravoting/voting_disk_01)
[ CSSD]2007-11-01 11:46:26.403 [1] >TRACE: clssnmDiskStateChange: state from 1
to 2 disk (2//u02/oravoting/voting_disk_02
)
[ CSSD]2007-11-01 11:46:26.404 [8] >TRACE: clssnmvDPT: spawned for disk 2 (/u02/oravoting/voting_disk_02)
[ CSSD]2007-11-01 11:46:26.405 [8] >ERROR: Internal Error Information:
Category: 1234
Operation: scls_block_open
Location: open
Other: open failed /u02/oravoting/voting_disk_02
Dep: 9
[ CSSD]2007-11-01 11:46:26.405 [8] >TRACE: clssnmvDiskOpen: Unable to open voting device (2:
/u02/oravoting/voting_disk_0
2)
If you were to change the permissions to oracle:dba the 2nd mirror you would not see the above.
Remember that when you install CRS in 10.2 and use normal redundancy for your voting disk configuration it is mandatory to have 2 mirrors. The installer does not allow you to proceed with one mirror.
If you are adding mirrors manually using crsctl it is recommended that you add 2 mirrors. If you had a 1+1 configuration css will not come up if the mirror is unavailable/corrupt.
If you are deleting a voting disk you have to update the following files in $ORA_CRS_HOME/install with the new voting disk location
paramfile.crs
params.crs
rootconfig
This is required if you need to re-initialize your OCR by re-running root.sh assuming your OCR backups are stuffed and you cannot restore your OCR.
To be safe it is best to do this with the cluster down.
I did the same recently on a 2 node RAC on 10.2.0.3 running Veritas SFRAC 4.1.
In the setup I am working on there is only one voting disk the location of which is
root@bart # /u01/app/oracle/product/10.1.0/crs/bin/crsctl query css votedisk
0. 0 /u02/oravoting/voting
With CRS down on all nodes you have to use the force option else you receive an error
root@bart # /u01/app/oracle/product/10.1.0/crs/bin/crsctl add css votedisk /u02/oravoting/voting_disk_01
Cluster is not in a ready state for online disk addition
root@bart # /u01/app/oracle/product/10.1.0/crs/bin/crsctl add css votedisk /u02/oravoting/voting_disk_01 -force
Now formatting voting disk: /u02/oravoting/voting_disk_01
CLSFMT returned with error [4].
failed 9 to initailize votedisk /u02/oravoting/voting_disk_01
root@bart # cd /u02/oravoting/
root@bart # ls -ltr
total 99992
-rw-r--r-- 1 oracle oinstall 10238976 Oct 30 11:53 voting
-rw-r--r-- 1 root other 10240000 Oct 30 12:05 voting_disk_01
So although it has created a second voting disk it has been created with the wrong permissions. When you do a fresh install of CRS the rootconfig script called from root.sh sets the owner of the voting disk to the owner of the crs software (in this case oracle). Hence this is a bug and the startup of css fails and you will see errors in the Unix logfile since the permissions are incorrect.
Lets’ add a second one..
root@bart # /u01/app/oracle/product/10.1.0/crs/bin/crsctl add css votedisk /u02/oravoting/voting_disk_02 -force
Now formatting voting disk: /u02/oravoting/voting_disk_02
CLSFMT returned with error [4].
failed 9 to initailize votedisk /u02/oravoting/voting_disk_02
If we do not change permissions of the second mirror css will startup (since we have 2 voting disks online and the algorithm requires that a majority of disks to be available) but the following message will be logged in the ocssd.log file
[ CSSD]2007-11-01 11:46:26.400 [1] >TRACE: clssnmDiskStateChange: state from 1 to 2 disk (0//u02/oravoting/voting)
[ CSSD]2007-11-01 11:46:26.401 [6] >TRACE: clssnmvDPT: spawned for disk 0
(/u02/oravoting/voting)
[ CSSD]2007-11-01 11:46:26.402 [1] >TRACE: clssnmDiskStateChange: state from 1 to 2 disk
(1//u02/oravoting/voting_disk_01
)
[ CSSD]2007-11-01 11:46:26.402 [7] >TRACE: clssnmvDPT: spawned for disk 1 (/u02/oravoting/voting_disk_01)
[ CSSD]2007-11-01 11:46:26.403 [1] >TRACE: clssnmDiskStateChange: state from 1
to 2 disk (2//u02/oravoting/voting_disk_02
)
[ CSSD]2007-11-01 11:46:26.404 [8] >TRACE: clssnmvDPT: spawned for disk 2 (/u02/oravoting/voting_disk_02)
[ CSSD]2007-11-01 11:46:26.405 [8] >ERROR: Internal Error Information:
Category: 1234
Operation: scls_block_open
Location: open
Other: open failed /u02/oravoting/voting_disk_02
Dep: 9
[ CSSD]2007-11-01 11:46:26.405 [8] >TRACE: clssnmvDiskOpen: Unable to open voting device (2:
/u02/oravoting/voting_disk_0
2)
If you were to change the permissions to oracle:dba the 2nd mirror you would not see the above.
Remember that when you install CRS in 10.2 and use normal redundancy for your voting disk configuration it is mandatory to have 2 mirrors. The installer does not allow you to proceed with one mirror.
If you are adding mirrors manually using crsctl it is recommended that you add 2 mirrors. If you had a 1+1 configuration css will not come up if the mirror is unavailable/corrupt.
If you are deleting a voting disk you have to update the following files in $ORA_CRS_HOME/install with the new voting disk location
paramfile.crs
params.crs
rootconfig
This is required if you need to re-initialize your OCR by re-running root.sh assuming your OCR backups are stuffed and you cannot restore your OCR.
Tuesday, October 16, 2007
Identifying mutex holder
In my previous post on flushing a cursor we see that a process is waiting on a mutex. In this post we will try to identify the holder from a systemstate dump
• Find the process executing the purge API. In this case it was process 22
• Open the systemstate dump and go to PROCESS 22
• Under this (if the systemstate is at level 266) you will see the short stack of the process
ksdxfstk()+36<-ksdxcb()+2452<-sspuser()+176<-sigacthandler()+44<-__systemcall()+52<-semtimedop()+28<-sskgpwwait()+224<-ksliwat
()+988<-kslwaitns_timed()+48<-kskthbwt()+232<-kslwait()+116<-kksLockWait()+396<-kgxWait()+444<-kgxExclusive()+132<-kxsPurgeCur
sor()+476<-psdpur()+1444<-pevm_icd_call_common()+728<-pfrinstr_ICAL()+132<-pfrrun_no_tool()+72<-pfrrun()+832<-plsql_run()+696<
-peicnt()+260<-kkxexe()+824<-opiexe()+12736<-kpoal8()+1912<-opiodr()+1548<-ttcpip()+1284<-opitsk()+1432<-opiino()+1128<-opiodr
()+1548<-opidrv()+896<-sou2o()+80<-opimai_real()+124<-main()+152<-_start()+380
As can be seen from the above stack it includes the function kxsPurgeCursor() which contains this piece of functionality (to flush the cursor)
• Under the session state object of this process you will see that the session is waiting on
waiting for 'cursor: pin X' blocking sess=0x0 seq=9208 wait_time=0 seconds since wait started=0 idn=dbabc3c, value=1, where|sleeps=e00000629
wait_time=0 indicates the session is waiting at the time this process was dumped.
• If you scroll down further in the same process state object and search for idn=dbabc3c
KGX Atomic Operation Log 3d6e12a08
Mutex 3da75c7d0(0, 1) idn dbabc3c oper GET_EXCL
Hence this process is waiting to acquire the mutex in exclusive mode.
• To find the process holding the mutex search on the string "dbabc3c oper"
You will find something like the below
KGX Atomic Operation Log 3d6e671e0
Mutex 3da75c7d0(0, 1) idn dbabc3c oper SHRD
Search the process holding this.
In vi editor you can use ?PROCESS which will lead you to
PROCESS 15:
-------------------------------------------
Hence Process 15 is holding the mutex and this is the process doing the merge join Cartesian in Session 1.
• Find the process executing the purge API. In this case it was process 22
• Open the systemstate dump and go to PROCESS 22
• Under this (if the systemstate is at level 266) you will see the short stack of the process
ksdxfstk()+36<-ksdxcb()+2452<-sspuser()+176<-sigacthandler()+44<-__systemcall()+52<-semtimedop()+28<-sskgpwwait()+224<-ksliwat
()+988<-kslwaitns_timed()+48<-kskthbwt()+232<-kslwait()+116<-kksLockWait()+396<-kgxWait()+444<-kgxExclusive()+132<-kxsPurgeCur
sor()+476<-psdpur()+1444<-pevm_icd_call_common()+728<-pfrinstr_ICAL()+132<-pfrrun_no_tool()+72<-pfrrun()+832<-plsql_run()+696<
-peicnt()+260<-kkxexe()+824<-opiexe()+12736<-kpoal8()+1912<-opiodr()+1548<-ttcpip()+1284<-opitsk()+1432<-opiino()+1128<-opiodr
()+1548<-opidrv()+896<-sou2o()+80<-opimai_real()+124<-main()+152<-_start()+380
As can be seen from the above stack it includes the function kxsPurgeCursor() which contains this piece of functionality (to flush the cursor)
• Under the session state object of this process you will see that the session is waiting on
waiting for 'cursor: pin X' blocking sess=0x0 seq=9208 wait_time=0 seconds since wait started=0 idn=dbabc3c, value=1, where|sleeps=e00000629
wait_time=0 indicates the session is waiting at the time this process was dumped.
• If you scroll down further in the same process state object and search for idn=dbabc3c
KGX Atomic Operation Log 3d6e12a08
Mutex 3da75c7d0(0, 1) idn dbabc3c oper GET_EXCL
Hence this process is waiting to acquire the mutex in exclusive mode.
• To find the process holding the mutex search on the string "dbabc3c oper"
You will find something like the below
KGX Atomic Operation Log 3d6e671e0
Mutex 3da75c7d0(0, 1) idn dbabc3c oper SHRD
Search the process holding this.
In vi editor you can use ?PROCESS which will lead you to
PROCESS 15:
-------------------------------------------
Hence Process 15 is holding the mutex and this is the process doing the merge join Cartesian in Session 1.
Friday, October 12, 2007
Flushing a single cursor
In a very intensive OLTP environment plan stability is of utmost importance as a single sub optimal query can bring the system down to its knees.
Using sql outlines and sql profiles is always not possible if you have an application with more
than a million lines of code and any one of the thousands of sql statements could have a plan flip.
In 11g there is a new procedure in the DBMS_SHARED_POOL package which helps you flush out a single cursor.
There is a typo in the syntax portion of the documentation in
http://download.oracle.com/docs/cd/B28359_01/appdev.111/b28419/d_shpool.htm#sthref8578
which I will try to get corrected in the next week.
PURGE Procedure
This procedure purges the named object or specified heap(s) of the object.
Syntax
DBMS_SHARED_POOL.KEEP (
name VARCHAR2,
flag CHAR DEFAULT 'P',
heaps NUMBER DEFAULT 1)
Parameters
Table 118-4 KEEP Procedure Parameters
Parameter Description
name Name of the object to keep.
The value for this identifier is the concatenation of the address and hash_value columns from the v$sqlarea view. This is displayed by the SIZES procedure.
Currently, TABLE and VIEW objects may not be kept.
flag (Optional) If this is not specified, then the package assumes that the first parameter is the name of a package/procedure/function and resolves the name.
Set to 'P' or 'p' to fully specify that the input is the name of a package/procedure/function.
Set to 'T' or 't' to specify that the input is the name of a type.
Set to 'R' or 'r' to specify that the input is the name of a trigger.
Set to 'Q' or 'q' to specify that the input is the name of a sequence.
In case the first argument is a cursor address and hash-value, the parameter should be set to any character except 'P' or 'p' or 'Q' or 'q' or 'R' or 'r' or 'T' or 't'.
heaps Heaps to be purged. For example, if heap 0 and heap 6 are to be purged:
1<<0 | 1<<6 => hex 0x41 => decimal 65, so specify heaps =>65.Default is 1, that is, heap 0 which means the whole object would be purged
This feature was introduced via the fix in bug 5614566 and I actually know a customer who has this applied on top of 10.2.0.3.
E.g
SQL> exec dbms_shared_pool.purge('00000003DE576D40,353632309','C',65); ==> purge heap 0 and heap 6
PL/SQL procedure successfully completed.
This would actually not work against a cursor which is currently executing.(pinned)
Session 1:
=========
Do a massive Merge Join Cartesian
select * from dba_objects a, dba_objects b, dba_objects c;
Session 2:
=========
Identify the sql address and hash value and try to purge the cursor..
exec dbms_shared_pool.purge('00000003DE825198,3691928467','C',65); ==> This hangs
and this session is waiting on "cursor: pin X" requesting an exclusive mutex pin for the cursor object whilst it has already been pinned by session 1
Session 3
==========
select event,p1,p2 from v$session where username='SYS' and type='USER';
EVENT P1 P2
----------------------------------------- ---------- ----------
cursor: pin X 3691928467 1
The p1 value here is the Hash value of the cursor we are trying to flush.
From the short stack of the process which is executing the purge API a function called kxsPurgeCursor is called which would try to take a mutex (since _kks_use_mutex_pin is TRUE by default)
The purge completes only after you cancel the sql in session 1 and exit from the same
or kill the session executing the sql.
Using sql outlines and sql profiles is always not possible if you have an application with more
than a million lines of code and any one of the thousands of sql statements could have a plan flip.
In 11g there is a new procedure in the DBMS_SHARED_POOL package which helps you flush out a single cursor.
There is a typo in the syntax portion of the documentation in
http://download.oracle.com/docs/cd/B28359_01/appdev.111/b28419/d_shpool.htm#sthref8578
which I will try to get corrected in the next week.
PURGE Procedure
This procedure purges the named object or specified heap(s) of the object.
Syntax
DBMS_SHARED_POOL.KEEP (
name VARCHAR2,
flag CHAR DEFAULT 'P',
heaps NUMBER DEFAULT 1)
Parameters
Table 118-4 KEEP Procedure Parameters
Parameter Description
name Name of the object to keep.
The value for this identifier is the concatenation of the address and hash_value columns from the v$sqlarea view. This is displayed by the SIZES procedure.
Currently, TABLE and VIEW objects may not be kept.
flag (Optional) If this is not specified, then the package assumes that the first parameter is the name of a package/procedure/function and resolves the name.
Set to 'P' or 'p' to fully specify that the input is the name of a package/procedure/function.
Set to 'T' or 't' to specify that the input is the name of a type.
Set to 'R' or 'r' to specify that the input is the name of a trigger.
Set to 'Q' or 'q' to specify that the input is the name of a sequence.
In case the first argument is a cursor address and hash-value, the parameter should be set to any character except 'P' or 'p' or 'Q' or 'q' or 'R' or 'r' or 'T' or 't'.
heaps Heaps to be purged. For example, if heap 0 and heap 6 are to be purged:
1<<0 | 1<<6 => hex 0x41 => decimal 65, so specify heaps =>65.Default is 1, that is, heap 0 which means the whole object would be purged
This feature was introduced via the fix in bug 5614566 and I actually know a customer who has this applied on top of 10.2.0.3.
E.g
SQL> exec dbms_shared_pool.purge('00000003DE576D40,353632309','C',65); ==> purge heap 0 and heap 6
PL/SQL procedure successfully completed.
This would actually not work against a cursor which is currently executing.(pinned)
Session 1:
=========
Do a massive Merge Join Cartesian
select * from dba_objects a, dba_objects b, dba_objects c;
Session 2:
=========
Identify the sql address and hash value and try to purge the cursor..
exec dbms_shared_pool.purge('00000003DE825198,3691928467','C',65); ==> This hangs
and this session is waiting on "cursor: pin X" requesting an exclusive mutex pin for the cursor object whilst it has already been pinned by session 1
Session 3
==========
select event,p1,p2 from v$session where username='SYS' and type='USER';
EVENT P1 P2
----------------------------------------- ---------- ----------
cursor: pin X 3691928467 1
The p1 value here is the Hash value of the cursor we are trying to flush.
From the short stack of the process which is executing the purge API a function called kxsPurgeCursor is called which would try to take a mutex (since _kks_use_mutex_pin is TRUE by default)
The purge completes only after you cancel the sql in session 1 and exit from the same
or kill the session executing the sql.
Monday, September 17, 2007
Redwood Shores

I was in Redwood last week and got a chance to meet some of the best minds in Server Technologies including a few ex-colleagues and a couple of guys on the revered
Oak Table
And although a significant part of the week was spent in the wine and lounge bars of San Francisco it was quite an enriching experience..
Wednesday, September 05, 2007
Disabling cursor trace
Sometime last year I had blogged about unshared cursors and an event to trace the same here
http://el-caro.blogspot.com/search?q=cursor+trace
Well after you set the trace on and have got the required information you would obviously want to turn it off.
The command to do the same is
alter system set events 'immediate trace name cursortrace level 2147483648, addr 1';
However this does not work as I realized today when I was diagnosing multiple versions created for pl/sql procedure calls with ref cursors as arguments and the trace almost filled up my udump. New sessions spawned have entries such as the below
for any cursor executed.
CUR#2 XSC 0xxxxxxxx CHILD#0 CI 0xxxxxxx CTX (nil)
To fix this issue you need to apply the fix for unpublished bug
5555371 NO WAY TO TURN OFF TRACE AFTER SETTING CURSORTRACE EVENT
on top of 10.2.0.x
Another way to disable the trace would be to restart the instance.
http://el-caro.blogspot.com/search?q=cursor+trace
Well after you set the trace on and have got the required information you would obviously want to turn it off.
The command to do the same is
alter system set events 'immediate trace name cursortrace level 2147483648, addr 1';
However this does not work as I realized today when I was diagnosing multiple versions created for pl/sql procedure calls with ref cursors as arguments and the trace almost filled up my udump. New sessions spawned have entries such as the below
for any cursor executed.
CUR#2 XSC 0xxxxxxxx CHILD#0 CI 0xxxxxxx CTX (nil)
To fix this issue you need to apply the fix for unpublished bug
5555371 NO WAY TO TURN OFF TRACE AFTER SETTING CURSORTRACE EVENT
on top of 10.2.0.x
Another way to disable the trace would be to restart the instance.
Saturday, July 14, 2007
Using dbx collector
It is quite possible that you have a single piece of sql which consumes more and more cpu over time without an increase in logical i/o for the statement or due to increased amount of hard parsing.
The reason could be extra burning of cpu in an Oracle source code function with time which has not been instrumented as a wait in the RDBMS kernel. One way to find out which function in the Oracle source code is the culprit is via the dbx collector function available in the Sun Studio 11. I guess dtrace would also help but I haven’t played with it. This tool can also be used in diagnosing increased cpu usage of Oracle tools across different RDBMS versions.
Let us take a simple example on how to run this tool on a simple insert statement.
SQL> create table foo ( a number);
Table created.
> sqlplus
SQL*Plus: Release 10.2.0.3.0 - Production on Sat Jul 14 23:46:03 2007
Copyright (c) 1982, 2006, Oracle. All Rights Reserved.
Enter user-name: /
Connected to:
Oracle Database 10g Enterprise Edition Release 10.2.0.3.0 - 64bit Production
With the Partitioning, Real Application Clusters, OLAP and Data Mining options
SQL> set sqlp sess1>>
sess1>>
Session 2
Find the server process servicing the previously spawned sqlplus session and attach to it via the debugger.
> ps -ef | grep sqlplus
oracle 20296 5857 0 23:47:38 pts/1 0:00 grep sqlplus
oracle 17205 23919 0 23:46:03 pts/4 0:00 sqlplus
> ps -ef | grep 17205
oracle 20615 5857 0 23:47:48 pts/1 0:00 grep 17205
oracle 17237 17205 0 23:46:04 ? 0:00 oracleTEST1 (DESCRIPTION=(LOCAL=YES)(ADDRESS=(PROTOCOL=beq)))
oracle 17205 23919 0 23:46:03 pts/4 0:00 sqlplus
> /opt/SUNWspro/bin/dbx $ORACLE_HOME/bin/oracle 17237
Reading oracle
==> Output trimmed for brevity.
dbx: warning: thread related commands will not be available
dbx: warning: see `help lwp', `help lwps' and `help where'
Attached to process 17237 with 2 LWPs
(l@1) stopped in _read at 0xffffffff7bfa8724
0xffffffff7bfa8724: _read+0x0008: ta 64
(dbx) collector enable
Session 1
==================================================================
begin
for i in 1..1000
loop
insert into foo values(i);
end loop;
end;
/
Session 2
==================================================================
(dbx) cont
Creating experiment database test.3.er ...
Reading libcollector.so
Session 1
==================================================================
PL/SQL procedure successfully completed.
sess1>>exit
Disconnected from Oracle Database 10g Enterprise Edition Release 10.2.0.3.0 - 64bit Production
With the Partitioning, Real Application Clusters, OLAP and Data Mining options
Session 2
=========
execution completed, exit code is 0
(dbx) quit
The debugger creates a directory called test.1.er.
You can analyse the collected data by using analyser which is a GUI tool.
> export DISPLAY=10.59.49.9:0.0
> /opt/SUNWspro/bin/analyzer test.3.er
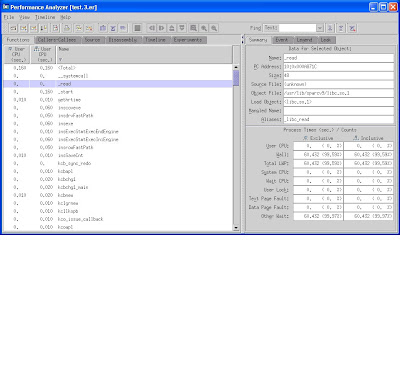
You can also generate a callers-callees report using the following syntax
/opt/SUNWspro/bin/er_print test.3.er
test.3.er: Experiment has warnings, see header for details
(/opt/SUNWspro/bin/er_print) callers-callees
A before and after image of the performance problem would help in diagnosing the function in the code which consumes more CPU with time.
The reason could be extra burning of cpu in an Oracle source code function with time which has not been instrumented as a wait in the RDBMS kernel. One way to find out which function in the Oracle source code is the culprit is via the dbx collector function available in the Sun Studio 11. I guess dtrace would also help but I haven’t played with it. This tool can also be used in diagnosing increased cpu usage of Oracle tools across different RDBMS versions.
Let us take a simple example on how to run this tool on a simple insert statement.
SQL> create table foo ( a number);
Table created.
> sqlplus
SQL*Plus: Release 10.2.0.3.0 - Production on Sat Jul 14 23:46:03 2007
Copyright (c) 1982, 2006, Oracle. All Rights Reserved.
Enter user-name: /
Connected to:
Oracle Database 10g Enterprise Edition Release 10.2.0.3.0 - 64bit Production
With the Partitioning, Real Application Clusters, OLAP and Data Mining options
SQL> set sqlp sess1>>
sess1>>
Session 2
Find the server process servicing the previously spawned sqlplus session and attach to it via the debugger.
> ps -ef | grep sqlplus
oracle 20296 5857 0 23:47:38 pts/1 0:00 grep sqlplus
oracle 17205 23919 0 23:46:03 pts/4 0:00 sqlplus
> ps -ef | grep 17205
oracle 20615 5857 0 23:47:48 pts/1 0:00 grep 17205
oracle 17237 17205 0 23:46:04 ? 0:00 oracleTEST1 (DESCRIPTION=(LOCAL=YES)(ADDRESS=(PROTOCOL=beq)))
oracle 17205 23919 0 23:46:03 pts/4 0:00 sqlplus
> /opt/SUNWspro/bin/dbx $ORACLE_HOME/bin/oracle 17237
Reading oracle
==> Output trimmed for brevity.
dbx: warning: thread related commands will not be available
dbx: warning: see `help lwp', `help lwps' and `help where'
Attached to process 17237 with 2 LWPs
(l@1) stopped in _read at 0xffffffff7bfa8724
0xffffffff7bfa8724: _read+0x0008: ta 64
(dbx) collector enable
Session 1
==================================================================
begin
for i in 1..1000
loop
insert into foo values(i);
end loop;
end;
/
Session 2
==================================================================
(dbx) cont
Creating experiment database test.3.er ...
Reading libcollector.so
Session 1
==================================================================
PL/SQL procedure successfully completed.
sess1>>exit
Disconnected from Oracle Database 10g Enterprise Edition Release 10.2.0.3.0 - 64bit Production
With the Partitioning, Real Application Clusters, OLAP and Data Mining options
Session 2
=========
execution completed, exit code is 0
(dbx) quit
The debugger creates a directory called test.1.er.
You can analyse the collected data by using analyser which is a GUI tool.
> export DISPLAY=10.59.49.9:0.0
> /opt/SUNWspro/bin/analyzer test.3.er

You can also generate a callers-callees report using the following syntax
/opt/SUNWspro/bin/er_print test.3.er
test.3.er: Experiment has warnings, see header for details
(/opt/SUNWspro/bin/er_print) callers-callees
A before and after image of the performance problem would help in diagnosing the function in the code which consumes more CPU with time.
Sunday, July 08, 2007
So 11g is finally upon us and it seems just the other day that 10g was released. I am looking forward to playing with some of the new features.
So here are some of the features in the TO DO list
Real Application Testing (RAT), which includes Database Replay and SQL Workload Analyzer.
APIs like
DBMS_WORKLOAD_CAPTURE
DBMS_WORKLOAD_REPLAY
Sql Plan Management
DBMS_SPM
DBMS_SHARED_POOL.PURGE api which can be used to flush a single cursor. This is important in a high intensive OLTP environment where you have a sql statement which has gone bad because of a sub-optimal execution plan. I believe this feature can be backported to 10.2.0.2/10.2.0.3
A new parameter MEMORY_MAX_TARGET has been introduced which would control both SGA and PGA memory allocation. I have not been a big fan of sga_target and hence would not pin my hopes too much on this feature.
There is a new SQL repair advisory provided through the DBMS_SQLDIAG api.
So here are some of the features in the TO DO list
Real Application Testing (RAT), which includes Database Replay and SQL Workload Analyzer.
APIs like
DBMS_WORKLOAD_CAPTURE
DBMS_WORKLOAD_REPLAY
Sql Plan Management
DBMS_SPM
DBMS_SHARED_POOL.PURGE api which can be used to flush a single cursor. This is important in a high intensive OLTP environment where you have a sql statement which has gone bad because of a sub-optimal execution plan. I believe this feature can be backported to 10.2.0.2/10.2.0.3
A new parameter MEMORY_MAX_TARGET has been introduced which would control both SGA and PGA memory allocation. I have not been a big fan of sga_target and hence would not pin my hopes too much on this feature.
There is a new SQL repair advisory provided through the DBMS_SQLDIAG api.
Saturday, June 30, 2007
Fix Control
Oracle has introduced a fix control mechanism in 10.2 which allows customers to turn off fixes for optimizer related bugs. This is governed by the underscore parameter _fix_control. The bugs for which fixes can be turned off are listed in v$session_fix_control and v$system_fix_control and can also be seen in a 10053 output.
On a 10.2.0.2 database
SQL> select distinct bugno from v$session_fix_control;
BUGNO
----------
3499674
4556762
4569940
3118776
4519016
4175830
4663698
4631959
4550003
4584065
4487253
4611850
4663804
4602374
4728348
4723244
4554846
4545833
4488689
4519340
20 rows selected.
SQL> select distinct sid from v$mystat;
SID
----------
143
SQL> alter session set "_fix_control"='4728348:OFF';
Session altered.
SQL> select * from v$session_fix_control where session_id=143 and bugno=4728348;
SESSION_ID BUGNO VALUE DESCRIPTION OPTIMIZER_FEATURE_ENABLE EVENT IS_DEFAULT
---------- ---------- ---------- ---------------------------------------------------------------- --
143 4728348 0 consider mjc if equi-joined pred is dropped in kkoipt 10.2.0.2
A value of 0 indicates the fix is off.
SQL> alter session set "_fix_control"='4728348:ON';
Session altered.
SQL> select * from v$session_fix_control where session_id=143 and bugno=4728348;
SESSION_ID BUGNO VALUE DESCRIPTION OPTIMIZER_FEATURE_ENABLE EVENT IS_DEFAULT
---------- ---------- ---------- ---------------------------------------------------------------- --
143 4728348 1 consider mjc if equi-joined pred is dropped in kkoipt 10.2.0.2
It appears to me that if you need two fixes off in a session you have to specify them together else you lose the first change.
SQL> alter session set "_fix_control"='4728348:OFF';
Session altered.
SQL> alter session set "_fix_control"='4663698:OFF';
Session altered.
SQL> select * from v$session_fix_control where session_id=143 and bugno in (4728348,4663698);
SESSION_ID BUGNO VALUE DESCRIPTION OPTIMIZER_FEATURE_ENABLE EVENT IS_DEFAULT
---------- ---------- ---------- ---------------------------------------------------------------- --
143 4663698 0 for cached NL table set tab_cost_io to zero 10.2.0.2 0 0
143 4728348 1 consider mjc if equi-joined pred is dropped in kkoipt 10.2.0.2
Hence if you need more than one fix OFF you need to supply both bug numbers in the same command
SQL> alter session set "_fix_control"='4728348:OFF','4663698:OFF';
Session altered.
SQL> select * from v$session_fix_control where session_id=143 and bugno in (4728348,4663698);
SESSION_ID BUGNO VALUE DESCRIPTION OPTIMIZER_FEATURE_ENABLE EVENT IS_DEFAULT
---------- ---------- ---------- ---------------------------------------------------------------- --
143 4663698 0 for cached NL table set tab_cost_io to zero 10.2.0.2 0 0
143 4728348 0 consider mjc if equi-joined pred is dropped in kkoipt 10.2.0.2
On a 10.2.0.2 database
SQL> select distinct bugno from v$session_fix_control;
BUGNO
----------
3499674
4556762
4569940
3118776
4519016
4175830
4663698
4631959
4550003
4584065
4487253
4611850
4663804
4602374
4728348
4723244
4554846
4545833
4488689
4519340
20 rows selected.
SQL> select distinct sid from v$mystat;
SID
----------
143
SQL> alter session set "_fix_control"='4728348:OFF';
Session altered.
SQL> select * from v$session_fix_control where session_id=143 and bugno=4728348;
SESSION_ID BUGNO VALUE DESCRIPTION OPTIMIZER_FEATURE_ENABLE EVENT IS_DEFAULT
---------- ---------- ---------- ---------------------------------------------------------------- --
143 4728348 0 consider mjc if equi-joined pred is dropped in kkoipt 10.2.0.2
A value of 0 indicates the fix is off.
SQL> alter session set "_fix_control"='4728348:ON';
Session altered.
SQL> select * from v$session_fix_control where session_id=143 and bugno=4728348;
SESSION_ID BUGNO VALUE DESCRIPTION OPTIMIZER_FEATURE_ENABLE EVENT IS_DEFAULT
---------- ---------- ---------- ---------------------------------------------------------------- --
143 4728348 1 consider mjc if equi-joined pred is dropped in kkoipt 10.2.0.2
It appears to me that if you need two fixes off in a session you have to specify them together else you lose the first change.
SQL> alter session set "_fix_control"='4728348:OFF';
Session altered.
SQL> alter session set "_fix_control"='4663698:OFF';
Session altered.
SQL> select * from v$session_fix_control where session_id=143 and bugno in (4728348,4663698);
SESSION_ID BUGNO VALUE DESCRIPTION OPTIMIZER_FEATURE_ENABLE EVENT IS_DEFAULT
---------- ---------- ---------- ---------------------------------------------------------------- --
143 4663698 0 for cached NL table set tab_cost_io to zero 10.2.0.2 0 0
143 4728348 1 consider mjc if equi-joined pred is dropped in kkoipt 10.2.0.2
Hence if you need more than one fix OFF you need to supply both bug numbers in the same command
SQL> alter session set "_fix_control"='4728348:OFF','4663698:OFF';
Session altered.
SQL> select * from v$session_fix_control where session_id=143 and bugno in (4728348,4663698);
SESSION_ID BUGNO VALUE DESCRIPTION OPTIMIZER_FEATURE_ENABLE EVENT IS_DEFAULT
---------- ---------- ---------- ---------------------------------------------------------------- --
143 4663698 0 for cached NL table set tab_cost_io to zero 10.2.0.2 0 0
143 4728348 0 consider mjc if equi-joined pred is dropped in kkoipt 10.2.0.2
Saturday, June 02, 2007
DBA_HIST_FILEMETRIC_HISTORY
There are so many new views in 10G that you begin to wonder if many of them are
actually populated correctly. For example there are quite a few bugs with some of the DBA_HIST* views not being populated correctly. One such view DBA_HIST_TBSPC_SPACE_USAGE is notorious for incorrect values .But the view DBA_HIST_FILEMETRIC_HISTORY which supposedly stores alerts only for 7 days does not even seem to be getting populated.
So on a 10.1.0.5 database
SQL> select count(*) from dba_hist_filemetric_history;
COUNT(*)
----------
0
If you have a look at the definition of the view from catawrvw.sql
create or replace view DBA_HIST_FILEMETRIC_HISTORY
(SNAP_ID, DBID, INSTANCE_NUMBER, FILEID, CREATIONTIME, BEGIN_TIME,
END_TIME, INTSIZE, GROUP_ID, AVGREADTIME, AVGWRITETIME, PHYSICALREAD,
PHYSICALWRITE, PHYBLKREAD, PHYBLKWRITE)
as
select fm.snap_id, fm.dbid, fm.instance_number,
fileid, creationtime, begin_time,
end_time, intsize, group_id, avgreadtime, avgwritetime,
physicalread, physicalwrite, phyblkread, phyblkwrite
from wrm$_snapshot sn, WRH$_FILEMETRIC_HISTORY fm
where sn.snap_id = fm.snap_id
and sn.dbid = fm.dbid
and sn.instance_number = fm.instance_number
and sn.status = 0
SQL> select count(*) from WRH$_FILEMETRIC_HISTORY;
COUNT(*)
----------
0
I have tried various ways to get this base table populated but
am not sure when information is flushed to WRH$_FILEMETRIC_HISTORY.
This behaviour is also consistent in 10.2.0.3
actually populated correctly. For example there are quite a few bugs with some of the DBA_HIST* views not being populated correctly. One such view DBA_HIST_TBSPC_SPACE_USAGE is notorious for incorrect values .But the view DBA_HIST_FILEMETRIC_HISTORY which supposedly stores alerts only for 7 days does not even seem to be getting populated.
So on a 10.1.0.5 database
SQL> select count(*) from dba_hist_filemetric_history;
COUNT(*)
----------
0
If you have a look at the definition of the view from catawrvw.sql
create or replace view DBA_HIST_FILEMETRIC_HISTORY
(SNAP_ID, DBID, INSTANCE_NUMBER, FILEID, CREATIONTIME, BEGIN_TIME,
END_TIME, INTSIZE, GROUP_ID, AVGREADTIME, AVGWRITETIME, PHYSICALREAD,
PHYSICALWRITE, PHYBLKREAD, PHYBLKWRITE)
as
select fm.snap_id, fm.dbid, fm.instance_number,
fileid, creationtime, begin_time,
end_time, intsize, group_id, avgreadtime, avgwritetime,
physicalread, physicalwrite, phyblkread, phyblkwrite
from wrm$_snapshot sn, WRH$_FILEMETRIC_HISTORY fm
where sn.snap_id = fm.snap_id
and sn.dbid = fm.dbid
and sn.instance_number = fm.instance_number
and sn.status = 0
SQL> select count(*) from WRH$_FILEMETRIC_HISTORY;
COUNT(*)
----------
0
I have tried various ways to get this base table populated but
am not sure when information is flushed to WRH$_FILEMETRIC_HISTORY.
This behaviour is also consistent in 10.2.0.3
Friday, May 18, 2007
What is Timeout?
The problem with semi documented APIs like DBMS_SPACE is that some of the subprograms might not work as you might expect them to.
For example the object_space_usage procedure has a parameter called timeout_value which I would assume to mean the amount of time after the procedure will abort if it cannot complete its space calculations. But this does not work as I would expect it to
SQL> set timing on
SQL> set serveroutput on
SQL> declare
v_space_used number;
v_space_allocated number;
begin
dbms_space.object_space_usage('SCOTT','EMP','TABLE',0,v_space_used, v_space_allocated,'',TRUE,5);
dbms_output.put_line('SPACE USED = '||v_space_used);
dbms_output.put_line('SPACE ALLOCATED = '||v_space_allocated);
end;
/
SPACE USED = 0
SPACE ALLOCATED = 68034756608
PL/SQL procedure successfully completed.
Elapsed: 00:00:36.12
So even if I specify a timeout value of 5 the procedure completes in 36 seconds.
This behaviour reproduces on 10.1.0.5 and 10.2.0.3.
For example the object_space_usage procedure has a parameter called timeout_value which I would assume to mean the amount of time after the procedure will abort if it cannot complete its space calculations. But this does not work as I would expect it to
SQL> set timing on
SQL> set serveroutput on
SQL> declare
v_space_used number;
v_space_allocated number;
begin
dbms_space.object_space_usage('SCOTT','EMP','TABLE',0,v_space_used, v_space_allocated,'',TRUE,5);
dbms_output.put_line('SPACE USED = '||v_space_used);
dbms_output.put_line('SPACE ALLOCATED = '||v_space_allocated);
end;
/
SPACE USED = 0
SPACE ALLOCATED = 68034756608
PL/SQL procedure successfully completed.
Elapsed: 00:00:36.12
So even if I specify a timeout value of 5 the procedure completes in 36 seconds.
This behaviour reproduces on 10.1.0.5 and 10.2.0.3.
Subscribe to:
Posts (Atom)