In my last blog I talked about adding mirrors to your voting disk. Here I will document how to add mirrors to your OCR on a clustered file system like vxfs.
In the existing configuration there is only one ocr. The location of your ocr is specified in /var/opt/oracle/ocr.loc (on Solaris). It would be different depending on your port.
You need to add an OCR mirror when CRS is up else you get an error message like the one below
root@bart # /u01/app/oracle/product/10.1.0/crs/bin/ocrconfig -replace ocrmirror /u02/oracrs/ocr_file_02
PROT-1: Failed to initialize ocrconfig
For more details on why you have received an error check the latest ocrconfig log file under $ORA_CRS_HOME/log/node/client
root@bart # cat ocrconfig_1742.log
Oracle Database 10g CRS Release 10.2.0.1.0 Production Copyright 1996, 2005 Oracle. All rights reserved.
2007-10-27 12:32:19.130: [ OCRCONF][1]ocrconfig starts...
2007-10-27 12:32:20.933: [ OCRCONF][1]Failure in initializing ocr in DEFAULT level. error:[PROC-32: Cluster Ready Services on the local node i
s not running Messaging error [9]]
2007-10-27 12:32:20.933: [ OCRCONF][1]Exiting [status=failed]...
From the above error message it is clear that CRS needs to be up.
So after starting up CRS
root@bart # /u01/app/oracle/product/10.1.0/crs/bin/ocrconfig -replace ocrmirror /u02/oracrs/ocr_file_02
PROT-16: Internal Error
But even though I get an error it appears to have created the mirror
root@bart # cat /var/opt/oracle/ocr.loc
#Device/file getting replaced by device
/u02/oracrs/ocr_file_02
ocrconfig_loc=/u02/oracrs/ocr.dbf
ocrmirrorconfig_loc=/u02/oracrs/ocr_file_02
local_only=falseroot@bart
# ocrcheck
Status of Oracle Cluster Registry is as follows :
Version : 2
Total space (kbytes) : 262120
Used space (kbytes) : 24932
Available space (kbytes) : 237188
ID : 1909893349
Device/File Name : /u02/oracrs/ocr.dbf
Device/File integrity check succeeded
Device/File Name : /u02/oracrs/ocr_file_02
Device/File integrity check succeeded
Now let us replace the existing OCR with a new one file
u01/app/oracle/product/10.1.0/crs/bin/ocrconfig -replace ocr /u02/oracrs/ocr_file_01
PROT-16: Internal Error
root@bart # cat /var/opt/oracle/ocr.loc
#Device/file /u02/oracrs/ocr.dbf getting replaced by device
/u02/oracrs/ocr_file_01
ocrconfig_loc=/u02/oracrs/ocr_file_01
ocrmirrorconfig_loc=/u02/oracrs/ocr_file_02
local_only=falseroot@bart
# ocrcheck
Status of Oracle Cluster Registry is as follows :
Version : 2
Total space (kbytes) : 262120
Used space (kbytes) : 24932
Available space (kbytes) : 237188
ID : 1909893349
Device/File Name : /u02/oracrs/ocr_file_01
Device/File integrity check succeeded
Device/File Name : /u02/oracrs/ocr_file_02
Device/File integrity check succeeded
Cluster registry integrity check succeeded
At this point you can shutdown and startup CRS and see if all is fine. One point to note is that you should check that the ocr.loc files on all remote nodes are updated with the updated location of the OCR file. In my testing the CRS stack on the remote node was down and in such cases the ocr.loc on the remote node does not get updated.
When the cluster is running if the OCR mirror is removed/corrupted the cluster continues running and all crs commands including ocrcheck can be run if you comment the following line from /var/opt/oracle/ocr.loc
ocrmirrorconfig_loc=/u02/oracrs/ocr_file_02
If you lose the primary OCR the cluster keeps running but
ocrcheck fails and CRS cannot be stopped even if you comment out the following line even though the mirror is available.
root@bart # cat /var/opt/oracle/ocr.loc
#Device/file /u02/oracrs/ocr_file_01 getting replaced by device /u02/oracrs/ocr_file_01
#ocrconfig_loc=/u02/oracrs/ocr_file_01
ocrmirrorconfig_loc=/u02/oracrs/ocr_file_02
Things are fine if I replace the ocr using
root@bart # /u01/app/oracle/product/10.1.0/crs/bin/ocrconfig -replace ocr /u02/oracrs/ocr_file_01
PROT-16: Internal Error
Tuesday, November 06, 2007
Saturday, November 03, 2007
Voting disk mirroring
A while ago I had blogged on how to add a voting disk to an existing RAC setup here.
To be safe it is best to do this with the cluster down.
I did the same recently on a 2 node RAC on 10.2.0.3 running Veritas SFRAC 4.1.
In the setup I am working on there is only one voting disk the location of which is
root@bart # /u01/app/oracle/product/10.1.0/crs/bin/crsctl query css votedisk
0. 0 /u02/oravoting/voting
With CRS down on all nodes you have to use the force option else you receive an error
root@bart # /u01/app/oracle/product/10.1.0/crs/bin/crsctl add css votedisk /u02/oravoting/voting_disk_01
Cluster is not in a ready state for online disk addition
root@bart # /u01/app/oracle/product/10.1.0/crs/bin/crsctl add css votedisk /u02/oravoting/voting_disk_01 -force
Now formatting voting disk: /u02/oravoting/voting_disk_01
CLSFMT returned with error [4].
failed 9 to initailize votedisk /u02/oravoting/voting_disk_01
root@bart # cd /u02/oravoting/
root@bart # ls -ltr
total 99992
-rw-r--r-- 1 oracle oinstall 10238976 Oct 30 11:53 voting
-rw-r--r-- 1 root other 10240000 Oct 30 12:05 voting_disk_01
So although it has created a second voting disk it has been created with the wrong permissions. When you do a fresh install of CRS the rootconfig script called from root.sh sets the owner of the voting disk to the owner of the crs software (in this case oracle). Hence this is a bug and the startup of css fails and you will see errors in the Unix logfile since the permissions are incorrect.
Lets’ add a second one..
root@bart # /u01/app/oracle/product/10.1.0/crs/bin/crsctl add css votedisk /u02/oravoting/voting_disk_02 -force
Now formatting voting disk: /u02/oravoting/voting_disk_02
CLSFMT returned with error [4].
failed 9 to initailize votedisk /u02/oravoting/voting_disk_02
If we do not change permissions of the second mirror css will startup (since we have 2 voting disks online and the algorithm requires that a majority of disks to be available) but the following message will be logged in the ocssd.log file
[ CSSD]2007-11-01 11:46:26.400 [1] >TRACE: clssnmDiskStateChange: state from 1 to 2 disk (0//u02/oravoting/voting)
[ CSSD]2007-11-01 11:46:26.401 [6] >TRACE: clssnmvDPT: spawned for disk 0
(/u02/oravoting/voting)
[ CSSD]2007-11-01 11:46:26.402 [1] >TRACE: clssnmDiskStateChange: state from 1 to 2 disk
(1//u02/oravoting/voting_disk_01
)
[ CSSD]2007-11-01 11:46:26.402 [7] >TRACE: clssnmvDPT: spawned for disk 1 (/u02/oravoting/voting_disk_01)
[ CSSD]2007-11-01 11:46:26.403 [1] >TRACE: clssnmDiskStateChange: state from 1
to 2 disk (2//u02/oravoting/voting_disk_02
)
[ CSSD]2007-11-01 11:46:26.404 [8] >TRACE: clssnmvDPT: spawned for disk 2 (/u02/oravoting/voting_disk_02)
[ CSSD]2007-11-01 11:46:26.405 [8] >ERROR: Internal Error Information:
Category: 1234
Operation: scls_block_open
Location: open
Other: open failed /u02/oravoting/voting_disk_02
Dep: 9
[ CSSD]2007-11-01 11:46:26.405 [8] >TRACE: clssnmvDiskOpen: Unable to open voting device (2:
/u02/oravoting/voting_disk_0
2)
If you were to change the permissions to oracle:dba the 2nd mirror you would not see the above.
Remember that when you install CRS in 10.2 and use normal redundancy for your voting disk configuration it is mandatory to have 2 mirrors. The installer does not allow you to proceed with one mirror.
If you are adding mirrors manually using crsctl it is recommended that you add 2 mirrors. If you had a 1+1 configuration css will not come up if the mirror is unavailable/corrupt.
If you are deleting a voting disk you have to update the following files in $ORA_CRS_HOME/install with the new voting disk location
paramfile.crs
params.crs
rootconfig
This is required if you need to re-initialize your OCR by re-running root.sh assuming your OCR backups are stuffed and you cannot restore your OCR.
Tuesday, October 16, 2007
Identifying mutex holder
In my previous post on flushing a cursor we see that a process is waiting on a mutex. In this post we will try to identify the holder from a systemstate dump
• Find the process executing the purge API. In this case it was process 22
• Open the systemstate dump and go to PROCESS 22
• Under this (if the systemstate is at level 266) you will see the short stack of the process
ksdxfstk()+36<-ksdxcb()+2452<-sspuser()+176<-sigacthandler()+44<-__systemcall()+52<-semtimedop()+28<-sskgpwwait()+224<-ksliwat
()+988<-kslwaitns_timed()+48<-kskthbwt()+232<-kslwait()+116<-kksLockWait()+396<-kgxWait()+444<-kgxExclusive()+132<-kxsPurgeCur
sor()+476<-psdpur()+1444<-pevm_icd_call_common()+728<-pfrinstr_ICAL()+132<-pfrrun_no_tool()+72<-pfrrun()+832<-plsql_run()+696<
-peicnt()+260<-kkxexe()+824<-opiexe()+12736<-kpoal8()+1912<-opiodr()+1548<-ttcpip()+1284<-opitsk()+1432<-opiino()+1128<-opiodr
()+1548<-opidrv()+896<-sou2o()+80<-opimai_real()+124<-main()+152<-_start()+380
As can be seen from the above stack it includes the function kxsPurgeCursor() which contains this piece of functionality (to flush the cursor)
• Under the session state object of this process you will see that the session is waiting on
waiting for 'cursor: pin X' blocking sess=0x0 seq=9208 wait_time=0 seconds since wait started=0 idn=dbabc3c, value=1, where|sleeps=e00000629
wait_time=0 indicates the session is waiting at the time this process was dumped.
• If you scroll down further in the same process state object and search for idn=dbabc3c
KGX Atomic Operation Log 3d6e12a08
Mutex 3da75c7d0(0, 1) idn dbabc3c oper GET_EXCL
Hence this process is waiting to acquire the mutex in exclusive mode.
• To find the process holding the mutex search on the string "dbabc3c oper"
You will find something like the below
KGX Atomic Operation Log 3d6e671e0
Mutex 3da75c7d0(0, 1) idn dbabc3c oper SHRD
Search the process holding this.
In vi editor you can use ?PROCESS which will lead you to
PROCESS 15:
-------------------------------------------
Hence Process 15 is holding the mutex and this is the process doing the merge join Cartesian in Session 1.
Friday, October 12, 2007
Flushing a single cursor
In a very intensive OLTP environment plan stability is of utmost importance as a single sub optimal query can bring the system down to its knees.
Using sql outlines and sql profiles is always not possible if you have an application with more
than a million lines of code and any one of the thousands of sql statements could have a plan flip.
In 11g there is a new procedure in the DBMS_SHARED_POOL package which helps you flush out a single cursor.
There is a typo in the syntax portion of the documentation in
http://download.oracle.com/docs/cd/B28359_01/appdev.111/b28419/d_shpool.htm#sthref8578
which I will try to get corrected in the next week.
PURGE Procedure
This procedure purges the named object or specified heap(s) of the object.
Syntax
DBMS_SHARED_POOL.KEEP (
name VARCHAR2,
flag CHAR DEFAULT 'P',
heaps NUMBER DEFAULT 1)
Parameters
Table 118-4 KEEP Procedure Parameters
Parameter Description
name Name of the object to keep.
The value for this identifier is the concatenation of the address and hash_value columns from the v$sqlarea view. This is displayed by the SIZES procedure.
Currently, TABLE and VIEW objects may not be kept.
flag (Optional) If this is not specified, then the package assumes that the first parameter is the name of a package/procedure/function and resolves the name.
Set to 'P' or 'p' to fully specify that the input is the name of a package/procedure/function.
Set to 'T' or 't' to specify that the input is the name of a type.
Set to 'R' or 'r' to specify that the input is the name of a trigger.
Set to 'Q' or 'q' to specify that the input is the name of a sequence.
In case the first argument is a cursor address and hash-value, the parameter should be set to any character except 'P' or 'p' or 'Q' or 'q' or 'R' or 'r' or 'T' or 't'.
heaps Heaps to be purged. For example, if heap 0 and heap 6 are to be purged:
1<<0 | 1<<6 => hex 0x41 => decimal 65, so specify heaps =>65.Default is 1, that is, heap 0 which means the whole object would be purged
This feature was introduced via the fix in bug 5614566 and I actually know a customer who has this applied on top of 10.2.0.3.
E.g
SQL> exec dbms_shared_pool.purge('00000003DE576D40,353632309','C',65); ==> purge heap 0 and heap 6
PL/SQL procedure successfully completed.
This would actually not work against a cursor which is currently executing.(pinned)
Session 1:
=========
Do a massive Merge Join Cartesian
select * from dba_objects a, dba_objects b, dba_objects c;
Session 2:
=========
Identify the sql address and hash value and try to purge the cursor..
exec dbms_shared_pool.purge('00000003DE825198,3691928467','C',65); ==> This hangs
and this session is waiting on "cursor: pin X" requesting an exclusive mutex pin for the cursor object whilst it has already been pinned by session 1
Session 3
==========
select event,p1,p2 from v$session where username='SYS' and type='USER';
EVENT P1 P2
----------------------------------------- ---------- ----------
cursor: pin X 3691928467 1
The p1 value here is the Hash value of the cursor we are trying to flush.
From the short stack of the process which is executing the purge API a function called kxsPurgeCursor is called which would try to take a mutex (since _kks_use_mutex_pin is TRUE by default)
The purge completes only after you cancel the sql in session 1 and exit from the same
or kill the session executing the sql.
Monday, September 17, 2007
Redwood Shores

I was in Redwood last week and got a chance to meet some of the best minds in Server Technologies including a few ex-colleagues and a couple of guys on the revered
Oak Table
And although a significant part of the week was spent in the wine and lounge bars of San Francisco it was quite an enriching experience..
Wednesday, September 05, 2007
Disabling cursor trace
Sometime last year I had blogged about unshared cursors and an event to trace the same here
http://el-caro.blogspot.com/search?q=cursor+trace
Well after you set the trace on and have got the required information you would obviously want to turn it off.
The command to do the same is
alter system set events 'immediate trace name cursortrace level 2147483648, addr 1';
However this does not work as I realized today when I was diagnosing multiple versions created for pl/sql procedure calls with ref cursors as arguments and the trace almost filled up my udump. New sessions spawned have entries such as the below
for any cursor executed.
CUR#2 XSC 0xxxxxxxx CHILD#0 CI 0xxxxxxx CTX (nil)
To fix this issue you need to apply the fix for unpublished bug
5555371 NO WAY TO TURN OFF TRACE AFTER SETTING CURSORTRACE EVENT
on top of 10.2.0.x
Another way to disable the trace would be to restart the instance.
Saturday, July 14, 2007
Using dbx collector
It is quite possible that you have a single piece of sql which consumes more and more cpu over time without an increase in logical i/o for the statement or due to increased amount of hard parsing.
The reason could be extra burning of cpu in an Oracle source code function with time which has not been instrumented as a wait in the RDBMS kernel. One way to find out which function in the Oracle source code is the culprit is via the dbx collector function available in the Sun Studio 11. I guess dtrace would also help but I haven’t played with it. This tool can also be used in diagnosing increased cpu usage of Oracle tools across different RDBMS versions.
Let us take a simple example on how to run this tool on a simple insert statement.
SQL> create table foo ( a number);
Table created.
> sqlplus
SQL*Plus: Release 10.2.0.3.0 - Production on Sat Jul 14 23:46:03 2007
Copyright (c) 1982, 2006, Oracle. All Rights Reserved.
Enter user-name: /
Connected to:
Oracle Database 10g Enterprise Edition Release 10.2.0.3.0 - 64bit Production
With the Partitioning, Real Application Clusters, OLAP and Data Mining options
SQL> set sqlp sess1>>
sess1>>
Session 2
Find the server process servicing the previously spawned sqlplus session and attach to it via the debugger.
> ps -ef | grep sqlplus
oracle 20296 5857 0 23:47:38 pts/1 0:00 grep sqlplus
oracle 17205 23919 0 23:46:03 pts/4 0:00 sqlplus
> ps -ef | grep 17205
oracle 20615 5857 0 23:47:48 pts/1 0:00 grep 17205
oracle 17237 17205 0 23:46:04 ? 0:00 oracleTEST1 (DESCRIPTION=(LOCAL=YES)(ADDRESS=(PROTOCOL=beq)))
oracle 17205 23919 0 23:46:03 pts/4 0:00 sqlplus
> /opt/SUNWspro/bin/dbx $ORACLE_HOME/bin/oracle 17237
Reading oracle
==> Output trimmed for brevity.
dbx: warning: thread related commands will not be available
dbx: warning: see `help lwp', `help lwps' and `help where'
Attached to process 17237 with 2 LWPs
(l@1) stopped in _read at 0xffffffff7bfa8724
0xffffffff7bfa8724: _read+0x0008: ta 64
(dbx) collector enable
Session 1
==================================================================
begin
for i in 1..1000
loop
insert into foo values(i);
end loop;
end;
/
Session 2
==================================================================
(dbx) cont
Creating experiment database test.3.er ...
Reading libcollector.so
Session 1
==================================================================
PL/SQL procedure successfully completed.
sess1>>exit
Disconnected from Oracle Database 10g Enterprise Edition Release 10.2.0.3.0 - 64bit Production
With the Partitioning, Real Application Clusters, OLAP and Data Mining options
Session 2
=========
execution completed, exit code is 0
(dbx) quit
The debugger creates a directory called test.1.er.
You can analyse the collected data by using analyser which is a GUI tool.
> export DISPLAY=10.59.49.9:0.0
> /opt/SUNWspro/bin/analyzer test.3.er
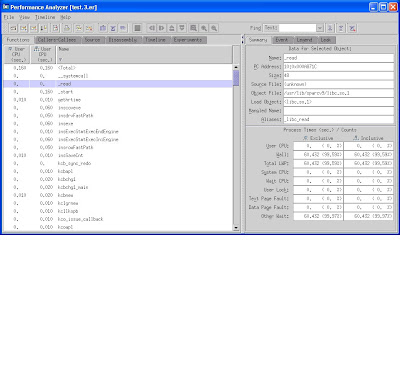
You can also generate a callers-callees report using the following syntax
/opt/SUNWspro/bin/er_print test.3.er
test.3.er: Experiment has warnings, see header for details
(/opt/SUNWspro/bin/er_print) callers-callees
A before and after image of the performance problem would help in diagnosing the function in the code which consumes more CPU with time.
Sunday, July 08, 2007
So 11g is finally upon us and it seems just the other day that 10g was released. I am looking forward to playing with some of the new features.
So here are some of the features in the TO DO list
Real Application Testing (RAT), which includes Database Replay and SQL Workload Analyzer.
APIs like
DBMS_WORKLOAD_CAPTURE
DBMS_WORKLOAD_REPLAY
Sql Plan Management
DBMS_SPM
DBMS_SHARED_POOL.PURGE api which can be used to flush a single cursor. This is important in a high intensive OLTP environment where you have a sql statement which has gone bad because of a sub-optimal execution plan. I believe this feature can be backported to 10.2.0.2/10.2.0.3
A new parameter MEMORY_MAX_TARGET has been introduced which would control both SGA and PGA memory allocation. I have not been a big fan of sga_target and hence would not pin my hopes too much on this feature.
There is a new SQL repair advisory provided through the DBMS_SQLDIAG api.
Saturday, June 30, 2007
Fix Control
Oracle has introduced a fix control mechanism in 10.2 which allows customers to turn off fixes for optimizer related bugs. This is governed by the underscore parameter _fix_control. The bugs for which fixes can be turned off are listed in v$session_fix_control and v$system_fix_control and can also be seen in a 10053 output.
On a 10.2.0.2 database
SQL> select distinct bugno from v$session_fix_control;
BUGNO
----------
3499674
4556762
4569940
3118776
4519016
4175830
4663698
4631959
4550003
4584065
4487253
4611850
4663804
4602374
4728348
4723244
4554846
4545833
4488689
4519340
20 rows selected.
SQL> select distinct sid from v$mystat;
SID
----------
143
SQL> alter session set "_fix_control"='4728348:OFF';
Session altered.
SQL> select * from v$session_fix_control where session_id=143 and bugno=4728348;
SESSION_ID BUGNO VALUE DESCRIPTION OPTIMIZER_FEATURE_ENABLE EVENT IS_DEFAULT
---------- ---------- ---------- ---------------------------------------------------------------- --
143 4728348 0 consider mjc if equi-joined pred is dropped in kkoipt 10.2.0.2
A value of 0 indicates the fix is off.
SQL> alter session set "_fix_control"='4728348:ON';
Session altered.
SQL> select * from v$session_fix_control where session_id=143 and bugno=4728348;
SESSION_ID BUGNO VALUE DESCRIPTION OPTIMIZER_FEATURE_ENABLE EVENT IS_DEFAULT
---------- ---------- ---------- ---------------------------------------------------------------- --
143 4728348 1 consider mjc if equi-joined pred is dropped in kkoipt 10.2.0.2
It appears to me that if you need two fixes off in a session you have to specify them together else you lose the first change.
SQL> alter session set "_fix_control"='4728348:OFF';
Session altered.
SQL> alter session set "_fix_control"='4663698:OFF';
Session altered.
SQL> select * from v$session_fix_control where session_id=143 and bugno in (4728348,4663698);
SESSION_ID BUGNO VALUE DESCRIPTION OPTIMIZER_FEATURE_ENABLE EVENT IS_DEFAULT
---------- ---------- ---------- ---------------------------------------------------------------- --
143 4663698 0 for cached NL table set tab_cost_io to zero 10.2.0.2 0 0
143 4728348 1 consider mjc if equi-joined pred is dropped in kkoipt 10.2.0.2
Hence if you need more than one fix OFF you need to supply both bug numbers in the same command
SQL> alter session set "_fix_control"='4728348:OFF','4663698:OFF';
Session altered.
SQL> select * from v$session_fix_control where session_id=143 and bugno in (4728348,4663698);
SESSION_ID BUGNO VALUE DESCRIPTION OPTIMIZER_FEATURE_ENABLE EVENT IS_DEFAULT
---------- ---------- ---------- ---------------------------------------------------------------- --
143 4663698 0 for cached NL table set tab_cost_io to zero 10.2.0.2 0 0
143 4728348 0 consider mjc if equi-joined pred is dropped in kkoipt 10.2.0.2
Saturday, June 02, 2007
DBA_HIST_FILEMETRIC_HISTORY
There are so many new views in 10G that you begin to wonder if many of them are
actually populated correctly. For example there are quite a few bugs with some of the DBA_HIST* views not being populated correctly. One such view DBA_HIST_TBSPC_SPACE_USAGE is notorious for incorrect values .But the view DBA_HIST_FILEMETRIC_HISTORY which supposedly stores alerts only for 7 days does not even seem to be getting populated.
So on a 10.1.0.5 database
SQL> select count(*) from dba_hist_filemetric_history;
COUNT(*)
----------
0
If you have a look at the definition of the view from catawrvw.sql
create or replace view DBA_HIST_FILEMETRIC_HISTORY
(SNAP_ID, DBID, INSTANCE_NUMBER, FILEID, CREATIONTIME, BEGIN_TIME,
END_TIME, INTSIZE, GROUP_ID, AVGREADTIME, AVGWRITETIME, PHYSICALREAD,
PHYSICALWRITE, PHYBLKREAD, PHYBLKWRITE)
as
select fm.snap_id, fm.dbid, fm.instance_number,
fileid, creationtime, begin_time,
end_time, intsize, group_id, avgreadtime, avgwritetime,
physicalread, physicalwrite, phyblkread, phyblkwrite
from wrm$_snapshot sn, WRH$_FILEMETRIC_HISTORY fm
where sn.snap_id = fm.snap_id
and sn.dbid = fm.dbid
and sn.instance_number = fm.instance_number
and sn.status = 0
SQL> select count(*) from WRH$_FILEMETRIC_HISTORY;
COUNT(*)
----------
0
I have tried various ways to get this base table populated but
am not sure when information is flushed to WRH$_FILEMETRIC_HISTORY.
This behaviour is also consistent in 10.2.0.3
Friday, May 18, 2007
What is Timeout?
The problem with semi documented APIs like DBMS_SPACE is that some of the subprograms might not work as you might expect them to.
For example the object_space_usage procedure has a parameter called timeout_value which I would assume to mean the amount of time after the procedure will abort if it cannot complete its space calculations. But this does not work as I would expect it to
SQL> set timing on
SQL> set serveroutput on
SQL> declare
v_space_used number;
v_space_allocated number;
begin
dbms_space.object_space_usage('SCOTT','EMP','TABLE',0,v_space_used, v_space_allocated,'',TRUE,5);
dbms_output.put_line('SPACE USED = '||v_space_used);
dbms_output.put_line('SPACE ALLOCATED = '||v_space_allocated);
end;
/
SPACE USED = 0
SPACE ALLOCATED = 68034756608
PL/SQL procedure successfully completed.
Elapsed: 00:00:36.12
So even if I specify a timeout value of 5 the procedure completes in 36 seconds.
This behaviour reproduces on 10.1.0.5 and 10.2.0.3.
Tuesday, April 24, 2007
More undocumented APIs in DBMS_SPACE
There seem to be quite a few procedures in the package DBMS_SPACE which do not find a mention in the Oracle documentation. One such procedure is
PROCEDURE OBJECT_SPACE_USAGE
Argument Name Type In/Out Default?
------------------------------ ----------------------- ------ --------
OBJECT_OWNER VARCHAR2 IN
OBJECT_NAME VARCHAR2 IN
OBJECT_TYPE VARCHAR2 IN
SAMPLE_CONTROL NUMBER IN
SPACE_USED NUMBER OUT
SPACE_ALLOCATED NUMBER OUT
PARTITION_NAME VARCHAR2 IN DEFAULT
PRESERVE_RESULT BOOLEAN IN DEFAULT
TIMEOUT_SECONDS NUMBER IN DEFAULT
which is used by OEM if you use the Segment Findings section on the Database Home page if you configure the same.
It could be useful to monitor space consumption of segments whilst subjected to continuous DML operations.
set serveroutput on;
declare
v_space_used number;
v_space_allocated number;
begin
dbms_space.object_space_usage(‘SCOTT’,'EMP','TABLE PARTITION',0,v_space_used, v_space_allocated, 'P1');
dbms_output.put_line('SPACE USED = '||v_space_used);
dbms_output.put_line('SPACE ALLOCATED = '||v_space_allocated);
end;
/
SPACE USED = 454248
SPACE ALLOCATED = 458752
PL/SQL procedure successfully completed.
I haven’t figured out what sample_control is though. Also this procedure does not work for spatial indexes as you encounter an ora-600.
Monday, April 23, 2007
KST tracing
In a recent post Kevin Closson highlights the perils of the effect of the the ORA_CRS_HOME mounpoint filling up.
If you use the RAC service framework services would relocate to another node after going offline on the node on which the filesystem is full
In a RAC cluster if a process encounters an ora-600 or an ora-7445 (I haven't checked for other errors) each node in the cluster dumps trace files for each process with suffix trw in directories called cdmp_YYYYMMDDHHMISS under bdump. This instrumentation is referred to as KST tracing. So if you have a batch job which continuously encounters the before mentioned errors this can cause a plethora of cdmp* directories generated which could fill up the filesystem.
These trace files can be formatted by an internal Oracle tool called Trace Loader (trcldr).
You can disable this functionality by setting trace_enabled=false which
can be changed dynamically. After making this change you will see the following
message in the diag trace file
***********************************************
KST tracing is turned off, no data is logged
***********************************************
This functionality is also disabled if you set _diag_daemon=false. This would disable the DIAG daemon and hence disable other functionality like the dumping of systemstates by the DIAG process when a self deadlock occurs. DIAG is the only background process which can be killed without instance death.It is the 2nd last process to be terminated because it needs to perform trace flushing to file system. By default, the terminating process, usually PMON, gives 5 seconds to DIAG for dumping. This is governed by the parameter _ksu_diag_kill_time. So after dumping all
diagnostic data PMON will wait for _ksu_diag_kill_time before killing the instance.
This delay has been fixed via bug 5599293
Saturday, March 24, 2007
Diagnosing archivelog corruption
When you encounter an archivelog corruption issue as seen from an ora-353 or ora-600 [3020] (stuck recovery) It is a common practice to dump the archivelog to determine the nature of the corruption.
Metalink note 1031381.6 explains various methods you can use to dump the same.
In addition you can also use the following command which only dumps the redo log file header although it reads the complete log file ( a truss on the associated server process can confirm the same) and hence you do not have the overhead of a large trace file (especially for large archivelogs)
SQL> alter system dump logfile 'D:\ARCHIVELOG\2007_03_24\O1_MF_1_48_3090F2FO_.ARC' layer 999 opcode 999;
System altered.
The associated trace file is shown below
***********************************************************
DUMP OF REDO FROM FILE 'D:\ARCHIVELOG\2007_03_24\O1_MF_1_48_3090F2FO_.ARC'
Opcode 999.999 only
RBAs: 0x000000.00000000.0000 thru 0xffffffff.ffffffff.ffff
SCNs: scn: 0x0000.00000000 thru scn: 0xffff.ffffffff
Times: creation thru eternity
FILE HEADER:
Compatibility Vsn = 169869824=0xa200200
Db ID=4004875527=0xeeb58d07, Db Name='TEN2'
Activation ID=4004873735=0xeeb58607
Control Seq=845=0x34d, File size=102400=0x19000
File Number=3, Blksiz=512, File Type=2 LOG
descrip:"Thread 0001, Seq# 0000000048, SCN 0x0000001614ba-0x0000001614df"
thread: 1 nab: 0xc seq: 0x00000030 hws: 0x2 eot: 0 dis: 0
resetlogs count: 0x2433e987 scn: 0x0000.00000001 (1)
resetlogs terminal rcv count: 0x0 scn: 0x0000.00000000
prev resetlogs count: 0x0 scn: 0x0000.00000000
prev resetlogs terminal rcv count: 0x0 scn: 0x0000.00000000
Low scn: 0x0000.001614ba (1447098) 03/24/2007 12:39:20
Next scn: 0x0000.001614df (1447135) 03/24/2007 12:40:50
Enabled scn: 0x0000.00000001 (1) 11/24/2006 21:11:44
Thread closed scn: 0x0000.001614ba (1447098) 03/24/2007 12:39:20
Disk cksum: 0xefe4 Calc cksum: 0xefe4
Terminal recovery stop scn: 0x0000.00000000
Terminal recovery 01/01/1988 00:00:00
Most recent redo scn: 0x0000.00000000
Largest LWN: 3 blocks
End-of-redo stream : No
Unprotected mode
Miscellaneous flags: 0x11
Thread internal enable indicator: thr: 0, seq: 0 scn: 0x0000.00000000
END OF REDO DUMP
----- Redo read statistics for thread 1 -----
Read rate (ASYNC): 5Kb in 0.05s => 0.10 Mb/sec
Total physical reads: 5Kb
Longest record: 1Kb, moves: 0/5 (0%)
Change moves: 6/33 (18%), moved: 0Mb
Longest LWN: 1Kb, moves: 0/4 (0%), moved: 0Mb
Last redo scn: 0x0000.001614db (1447131)
Tuesday, February 27, 2007
RMAN priorities
Whilst playing around with "_high_priority_processes” I ran across another hidden parameter called _rman_io_priority. Ostensibly this looks like another magic switch like _serial_direct_read to improve the speed of RMAN backups and restores.
But alas this parameter cannot be modified from its default value of 3
SQL> alter system set "_rman_io_priority"=6 scope=spfile;
alter system set "_rman_io_priority"=6 scope=spfile
*
ERROR at line 1:
ORA-00068: invalid value 6 for parameter _rman_io_priority, must be between 6
and 18446744073709551615
SQL> alter system set "_rman_io_priority"=7 ;
alter system set "_rman_io_priority"=7
*
ERROR at line 1:
ORA-00068: invalid value 7 for parameter _rman_io_priority, must be between 6 and 18446744073709551615
SQL> alter system set "_rman_io_priority"=18446744073709551614;
alter system set "_rman_io_priority"=18446744073709551614
*
ERROR at line 1:
ORA-02017: integer value required
The maximum value of an integer is 2147483647 or (2e31 -1)
SQL> alter system set "_rman_io_priority"=2147483647;
alter system set "_rman_io_priority"=2147483647
*
ERROR at line 1:
ORA-00068: invalid value 2147483647 for parameter _rman_io_priority, must be between 6 and 18446744073709551615
As this is an undocumented parameter I cannot raise an SR on this issue. My understanding is that this has been fixed in 11g although it still remains an undocumented parameter.
Sunday, February 18, 2007
LMS and real time priorities (2)
From my testing on 10.2.0.3 with the following combination of parameters these are the results
_high_priority_processes _os_sched_high_priority Scheduler class
LMS* (default) 1 (default) RR
Null 0 TS
LMS* (default) 0 RR
Null 1 (default) TS
As can be seen the value of _os_sched_high_priority doesn’t seem to matter (or is this another bug) and LMS seems to run in the RR class only if the value of _high_priority_processes is LMS*.
Also we put other oracle processes in the RR class using this same parameter?
SQL> alter system set "_high_priority_processes"='PMON' scope=spfile;
System altered.
SQL> exit
Disconnected from Oracle Database 10g Enterprise Edition Release 10.2.0.3.0 - Production
With the Partitioning, Real Application Clusters, OLAP and Data Mining options
elephant-> srvctl stop database -d F8902PRD
elephant-> srvctl start database -d F8902PRD
elephant-> ps -efc | grep pmon | grep –v grep
oracle 4929 1 RR 90 17:57 ? 00:00:00 ora_pmon_F8902PRD1
Also the parameter _high_priority_processes was not in the base release (10.2.0.1)
and introduced in the 10.2.0.3 patchset
Friday, February 16, 2007
LMS and real time priorities
One of the oft mentioned RAC best practices is that the priority of LMS processes which ship blocks across the interconnect be higher so that they are not competing for cpu cycles with other processes.
Starting with 10.2 LMS is supposed to run in the real time class. This is new functionality which is governed by the underscore parameter _os_sched_high_priority
However in 10.2.0.1 LMS still runs in the time-sharing TS class (SCHED_OTHER standard time-sharing) due to the absence of the oradism executable
buffalo >ls -al oradism
-r-sr-s--- 1 root dba 0 Jul 1 2005 oradism
buffalo >ps -efc|grep lms
oracle 27263 1 TS 24 2006 ? 00:12:38 ora_lms0_F8900DMO1
oracle 27273 1 TS 24 2006 ? 00:04:30 ora_lms1_F8900DMO1
When you apply the 10.2.0.3 patchset you notice that the oradism executable seems to be generated and LMS runs in the RR class (SCHED_RR round robin)
elephant-> ls -al oradism
-r-sr-s--- 1 root dba 14456 Nov 15 12:52 oradism
elephant-> ps -efc | grep lms
oracle 11554 1 RR 90 15:09 ? 00:00:01 ora_lms0_F8902PRD1
oracle 11558 1 RR 90 15:09 ? 00:00:01 ora_lms1_F8902PRD1
whereas other background processes like PMON still run in TS
elephant-> ps -efc | grep pmon | grep PRD
oracle 11544 1 TS 23 Feb14 ? 00:00:00 ora_pmon_F8902PRD1
I am not sure if this is ideal on a box with a low number of CPUs or if cache fusion traffic is not a major concern.If you want LMS to run in the same class as other processes you need to set _os_sched_high_priority back to 0 from its default value of 1 as seen from below
But doing this does not seem to change the class to TS
SQL> alter system set "_os_sched_high_priority"=0 scope=spfile;
System altered.
SQL> exit
Disconnected from Oracle Database 10g Enterprise Edition Release 10.2.0.3.0 - Production
With the Partitioning, Real Application Clusters, OLAP and Data Mining options
elephant-> srvctl stop database -d F8902PRD
elephant-> srvctl start database -d F8902PRD
elephant-> ps -efc | grep lms | grep PRD
oracle 17097 1 RR 90 09:54 ? 00:00:00 ora_lms0_F8902PRD1
oracle 17101 1 RR 90 09:54 ? 00:00:00 ora_lms1_F8902PRD1
1 select a.ksppinm "Parameter",
2 b.ksppstvl "Session Value",
3 c.ksppstvl "Instance Value"
4 from x$ksppi a, x$ksppcv b, x$ksppsv c
5 where a.indx = b.indx and a.indx = c.indx
6* and a.ksppinm like '%os_sched%'
SQL> /
Parameter
--------------------------------------------------------------------------------
Session Value
-------------------------------------------------------------------------------------------------------------------------------------------------
Instance Value
-------------------------------------------------------------------------------------------------------------------------------------------------
_os_sched_high_priority
0
0
From bug 5635098 it appears there is another parameter called
_high_priority_processes which needs to be set to null for this to work.
SQL> alter system set "_high_priority_processes"='' scope=spfile;
System altered.
elephant-> srvctl stop database -d F8902PRD
elephant-> srvctl start database -d F8902PRD
elephant-> ps -efc | grep lms | grep -v grep
oracle 31654 1 TS 24 00:58 ? 00:00:01 ora_lms0_F8902PRD1
oracle 31656 1 TS 24 00:58 ? 00:00:00 ora_lms1_F8902PRD1
As you can lms is now running in TS class.
On Solaris Sparc 64 bit be aware of bug 5258549 which causes boxes with low number of CPUs to freeze.
Friday, February 09, 2007
CRS Version
I notice that on a lot of forums the following is quite a common question
"How can I verify what version CRS is?".
The version of CRS can be higher than the version of database/ASM software. The commands to see the same are
crsctl query crs softwareversion
crsctl query crs activeversion
So although the difference between the two commands might be obvious I am not sure if this is documented anywhere. Also after upgrading from 10.2.0.1 to 10.2.0.2/10.2.0.3 the active version does not seem to change. This maybe due to bug 5278777 which should be fixed in the 10.2.0.4 patchset.
I upgraded a couple of clusters yesterday from 10.2.0.1 to 10.2.0.3 (without any issues per se) and this is what I see after the CRS upgrade.
elephant-> crsctl query crs softwareversion
CRS software version on node [elephant] is [10.2.0.3.0]
elephant-> crsctl query crs activeversion
CRS active version on the cluster is [10.2.0.1.0]
elephant-> cemutlo -w
2:1:
The cemutlo command is used by the EM agent to query CRS version.
Also a rolling upgrade of CRS causes the VIP to relocate to some other node and you have to manually relocate the same using crs_relocate. This is mentioned in the patchset readme though I am not sure how many customers actually read the section “Known Issues”.
Sunday, January 21, 2007
Checkpoint progress record
The checkpoint process record is written to by the CKPT process every 3 seconds.This update is more commonly known as the heartbeat.This can be verified from the following query
SELECT CPHBT from X$KCCCP where rownum < 2
CPHBT
----------
612542768
In versions prior to 10G there was only one record. For a single
instance in 10G there are 8 records in the above structure.
You can also check the same from a controlfile dump using the following event
alter session set events 'immediate trace name controlf level 12';
In versions prior to 10G level 10 would suffice to obtain a logical dump but
in my testing on versions 10.1.0.x and 10.2.0.x on various platforms
I have been able to get a controlfile dump only at level 12.
From the generate trace file in udump
***************************************************************************
CHECKPOINT PROGRESS RECORDS
***************************************************************************
(size = 8180, compat size = 8180, section max = 11, section in-use = 0,
last-recid= 0, old-recno = 0, last-recno = 0)
(extent = 1, blkno = 2, numrecs = 11)
THREAD #1 - status:0x2 flags:0x0 dirty:68
low cache rba:(0x7d.e82d.0) on disk rba:(0x7d.e8d9.0)
on disk scn: 0x0000.0043bea2 01/22/2007 13:10:24
resetlogs scn: 0x0000.0008026d 11/16/2006 16:57:26
heartbeat: 612542768 mount id: 2427095148
......
To verify that the heartbeat happens every 3 secs you can do an strace on the CKPT
process.
eiger-> ps -ef | grep ckp | grep -v grep
oracle 2739 1 0 07:14 ? 00:00:04 ora_ckpt_HRDEV
eiger-> strace -tt -o /tmp/ckpt.out -p 2739
Process 2739 attached - interrupt to quit
From /tmp/ckpt.out
13:31:26.742402 gettimeofday({1169433086, 742475}, NULL) = 0
13:31:26.742531 times(NULL) = 431667132
13:31:26.742602 pwrite(16, "\25\302\0\0\3\0\0\0\0\0\0\0\0\0\1\4a1\0\0\2\0\0\0\0\0\0"..., 16384, 49152) = 16384
13:31:26.743399 times(NULL) = 431667132
13:31:26.743529 times(NULL) = 431667132
13:31:26.743600 pwrite(17, "\25\302\0\0\3\0\0\0\0\0\0\0\0\0\1\4a1\0\0\2\0\0\0\0\0\0"..., 16384, 49152) = 16384
13:31:26.744262 times(NULL) = 431667132
13:31:26.744338 times(NULL) = 431667132
13:31:26.744409 pwrite(18, "\25\302\0\0\3\0\0\0\0\0\0\0\0\0\1\4a1\0\0\2\0\0\0\0\0\0"..., 16384, 49152) = 16384
13:31:26.744938 times(NULL) = 431667132
.........
13:31:29.750559 gettimeofday({1169433089, 750559}, NULL) = 0
13:31:29.750559 times(NULL) = 431667433
13:31:29.750559 pwrite(16, "\25\302\0\0\3\0\0\0\0\0\0\0\0\0\1\4`1\0\0\2\0\0\0\0\0\0"..., 16384, 49152) = 16384
13:31:29.752055 times(NULL) = 431667433
13:31:29.752122 times(NULL) = 431667433
13:31:29.752659 pwrite(17, "\25\302\0\0\3\0\0\0\0\0\0\0\0\0\1\4`1\0\0\2\0\0\0\0\0\0"..., 16384, 49152) = 16384
13:31:29.753758 times(NULL) = 431667433
13:31:29.753827 times(NULL) = 431667433
13:31:29.753896 pwrite(18, "\25\302\0\0\3\0\0\0\0\0\0\0\0\0\1\4`1\0\0\2\0\0\0\0\0\0"..., 16384, 49152) = 16384
13:31:29.754706 times(NULL) = 431667433
As seen from below file descriptors 16,17 and 18 correspond to the 3 controlfiles of this database
eiger-> cd /proc
eiger-> cd 2739
eiger-> cd fd
eiger-> ls -al 1?
eiger-> ls -al 1? | grep contro
lrwx------ 1 oracle oracle 64 Jan 22 13:42 16 -> /usr/opt/oracle/u01/oradata/HRDEV/control01.ctl
lrwx------ 1 oracle oracle 64 Jan 22 13:42 17 -> /usr/opt/oracle/u01/oradata/HRDEV/control02.ctl
lrwx------ 1 oracle oracle 64 Jan 22 13:42 18 -> /usr/opt/oracle/u01/oradata/HRDEV/control03.ctl
The block which holds the checkpoint progress record also holds the CFVRR (controlfile vote result record)which is used to resolve a split brain scenario when nodes in a cluster cannot talk to each other.
Thursday, January 18, 2007
RAC, Archivelog mode and cluster_database
In version prior to 10.2 one had to set the parameter cluster_database
to FALSE to switch the archivelog mode of a database
Starting with 10.2 you no longer need to modify the CLUSTER_DATABASE parameter setting to
change the archiving mode in RAC. You can change archivelog mode as long as
the database is mounted in the local instance and not open in any instances.
Lets' test the same...
elephant-> srvctl status database -d F8902PRD
Instance F8902PRD1 is running on node elephant
Instance F8902PRD2 is running on node rhino
Instance F8902PRD3 is running on node hippo
elephant-> sqlplus
SQL*Plus: Release 10.2.0.1.0 - Production on Fri Jan 19 09:12:21 2007
Copyright (c) 1982, 2005, Oracle. All rights reserved.
Enter user-name: / as sysdba
Connected to:
Oracle Database 10g Enterprise Edition Release 10.2.0.1.0 - Production
With the Partitioning, Real Application Clusters, OLAP and Data Mining options
SQL> archive log list
Database log mode Archive Mode
Automatic archival Enabled
Archive destination /u03/backup/F8902PRD/arch/
Oldest online log sequence 1103
Next log sequence to archive 1104
Current log sequence 1104
elephant-> srvctl stop database -d F8902PRD
elephant-> srvctl start instance -d F8902PRD -i F8902PRD1 -o mount
elephant-> srvctl status database -d F8902PRD
Instance F8902PRD1 is running on node elephant
Instance F8902PRD2 is not running on node rhino
Instance F8902PRD3 is not running on node hippo
SQL> show parameter cluster_database
NAME TYPE VALUE
------------------------------------ ----------- ------------------------------
cluster_database boolean TRUE
cluster_database_instances integer 3
SQL> alter database noarchivelog;
Database altered.
SQL> archive log list
Database log mode No Archive Mode
Automatic archival Disabled
Archive destination /u03/backup/F8902PRD/arch/
Oldest online log sequence 1103
Current log sequence 1104
elephant-> srvctl stop instance -d F8902PRD -i F8902PRD1
Now lets try to change back to archivelog mode by mounting the database from more
than one instance.
elephant-> srvctl start instance -d F8902PRD -i F8902PRD1 -o mount
elephant-> srvctl start instance -d F8902PRD -i F8902PRD2 -o mount
elephant-> srvctl status database -d F8902PRD
Instance F8902PRD1 is running on node elephant
Instance F8902PRD2 is running on node rhino
Instance F8902PRD3 is not running on node hippo
SQL> show parameter cluster_database
NAME TYPE VALUE
------------------------------------ ----------- ------------------------------
cluster_database boolean TRUE
cluster_database_instances integer 3
SQL> alter database archivelog;
Database altered.
SQL> archive log list
Database log mode Archive Mode
Automatic archival Enabled
Archive destination /u03/backup/F8902PRD/arch/
Oldest online log sequence 1103
Next log sequence to archive 1104
Current log sequence 1104
elephant-> srvctl stop database -d F8902PRD
elephant-> srvctl start instance -d F8902PRD -i F8902PRD1 -o mount
elephant-> srvctl start instance -d F8902PRD -i F8902PRD2 -o mount
elephant-> srvctl start instance -d F8902PRD -i F8902PRD2 -o open ==> I made a typo here. It should have been F8902PRD3
instead of F8902PRD2 but notice srvctl does not generate any errors. So u don't know if instance 2 has actually opened the database.
elephant-> srvctl start instance -d F8902PRD -i F8902PRD3 -o open
SQL> select inst_id,open_mode from gv$database;
INST_ID OPEN_MODE
---------- ----------
1 MOUNTED
2 MOUNTED
3 READ WRITE
So instance 3 has the db open while instances 1 and 2 have just mounted the database.
SQL> alter database noarchivelog;
alter database noarchivelog
*
ERROR at line 1:
ORA-01126: database must be mounted in this instance and not open in any
instance
*****************************************************************************************
However if you need to recreate the controlfile you need to set cluster_database to false
elephant-> srvctl stop database -d F8902PRD
elephant-> srvctl start instance -d F8902PRD -i F8902PRD1 -o nomount
elephant-> srvctl status database -d F8902PRD
Instance F8902PRD1 is running on node elephant
Instance F8902PRD2 is not running on node rhino
Instance F8902PRD3 is not running on node hippo
SQL> select inst_id,DATABASE_STATUS from gv$instance;
INST_ID DATABASE_STATUS
---------- -----------------
1 ACTIVE
SQL> @controlfile.sql
CREATE CONTROLFILE REUSE DATABASE "F8902PRD" NORESETLOGS ARCHIVELOG
*
ERROR at line 1:
ORA-01503: CREATE CONTROLFILE failed
ORA-12720: operation requires database is in EXCLUSIVE mode
Wednesday, January 10, 2007
The Optimizer and cache related statistics.
Jonathan Lewis in his excellent book on the CBO talks about new functionality within Oracle’s optimizer wherein the optimizer can use cache related statistics of objects to evaluate a more optimal execution plan.
All the following testing has been done on 10.2.0.3 with the hidden parameter _cache_stats_monitor set to TRUE (default is false)
The table cache_stats_1$ which is used to monitor lifetime caching statistics (c0902000.sql) is populated by MMON periodically via a MERGE statement which does not seem to be using bind variables. You can also populate the same directly using
SQL> exec dbms_stats_internal.flush_cache_stats;
PL/SQL procedure successfully completed.
For the purpose of this discussion we will concentrate on a normal heap table SCOTT.T1 with data_object_id = 58417 which is a replica of dba_tables.
SQL> select * from cache_stats_1$ where DATAOBJ#=58417
DATAOBJ# INST_ID CACHED_AVG CACHED_SQR_AVG CACHED_NO CACHED_SEQ_NO
---------- ---------- ---------- -------------- ---------- -------------
CHR_AVG CHR_SQR_AVG CHR_NO CHR_SEQ_NO LGR_SUM LGR_LAST PHR_LAST
---------- ----------- ---------- ---------- ---------- ---------- ----------
SPARE1 SPARE2 SPARE3 SPARE4 SPARE5
---------- ---------- ---------- ---------- ----------
58417 1 118.889076 14192.4521 35 2644
0 0 1 2575 0 768 0
Now if we were to gather cache related statistics for this table
SQL> exec dbms_stats.gather_table_stats('SCOTT','T1',stattype=>'CACHE');
PL/SQL procedure successfully completed.
A trace on the above API call reveals the following statement
********************************************************
insert into tab_stats$ (obj#,cachedblk,cachehit,logicalread) values (:1,:2,:3,:4)
Bind#0
oacdty=02 mxl=22(22) mxlc=00 mal=00 scl=00 pre=00
oacflg=08 fl2=0001 frm=00 csi=00 siz=24 off=0
kxsbbbfp=07723aa8 bln=22 avl=04 flg=05
value=58417
Bind#1
oacdty=02 mxl=22(22) mxlc=00 mal=00 scl=00 pre=00
oacflg=08 fl2=0001 frm=00 csi=00 siz=24 off=0
kxsbbbfp=07723a84 bln=24 avl=03 flg=05
value=118
Bind#2
oacdty=02 mxl=22(00) mxlc=00 mal=00 scl=00 pre=00
oacflg=08 fl2=0001 frm=00 csi=00 siz=24 off=0
kxsbbbfp=07723a60 bln=24 avl=00 flg=05
Bind#3
oacdty=02 mxl=22(00) mxlc=00 mal=00 scl=00 pre=00
oacflg=08 fl2=0001 frm=00 csi=00 siz=24 off=0
kxsbbbfp=07723a3c bln=24 avl=00 flg=05
********************************************************
Only the cachedblk column appears to be populated. (I haven’t had a chance to check this value against x$bh)
SQL> select * from tab_stats$ where obj#=58417;
OBJ# CACHEDBLK CACHEHIT LOGICALREAD ROWCNT BLKCNT EMPCNT
---------- ---------- ---------- ----------- ---------- ---------- ----------
AVGSPC CHNCNT AVGRLN AVGSPC_FLB FLBCNT ANALYZETI SAMPLESIZE
---------- ---------- ---------- ---------- ---------- --------- ----------
FLAGS SPARE1 SPARE2 SPARE3
---------- ---------- ---------- ----------
SPARE4
--------------------------------------------------------------------------------
SPARE5
--------------------------------------------------------------------------------
SPARE6
---------
58417 118
Checking the execution plans of statements with "_optimizer_cache_stats" set to TRUE and FALSE we find the cost of the table is almost half in the former.
SQL> conn scott/tiger
Connected.
SQL> set autotrace traceonly explain
SQL> alter session set "_optimizer_cache_stats" = true;
Session altered.
SQL> select count(*) from t1;
Execution Plan
----------------------------------------------------------
Plan hash value: 3724264953
-------------------------------------------------------------------
| Id | Operation | Name | Rows | Cost (%CPU)| Time |
-------------------------------------------------------------------
| 0 | SELECT STATEMENT | | 1 | 29 (0)| 00:00:01 |
| 1 | SORT AGGREGATE | | 1 | | |
| 2 | TABLE ACCESS FULL| T1 | 6446 | 29 (0)| 00:00:01 |
-------------------------------------------------------------------
SQL> alter session set "_optimizer_cache_stats" = false;
Session altered.
SQL> select count(*) from t1;
Execution Plan
----------------------------------------------------------
Plan hash value: 3724264953
-------------------------------------------------------------------
| Id | Operation | Name | Rows | Cost (%CPU)| Time |
-------------------------------------------------------------------
| 0 | SELECT STATEMENT | | 1 | 56 (0)| 00:00:01 |
| 1 | SORT AGGREGATE | | 1 | | |
| 2 | TABLE ACCESS FULL| T1 | 6446 | 56 (0)| 00:00:01 |
-------------------------------------------------------------------
Also for fixed objects the API dbms_stats.gather_fixed_objects_stats populates tab_stats$
Monday, January 08, 2007
Extracting info from AWR
The Automatic Workload Repository stores a wealth of performance related data in an Oracle 10g Database. Historical data can be viewed from the DBA_HIST* views depending on the retention period.
One can either write a query against any of the dba_hist_* views or use the API
dbms_sqltune.select_workload_repository
For e.g
To find out all sql stmts which took more than 1 hour to execute between 7:00 am and 10:00 am this morning
• Find the snapshots for that period
select snap_id,BEGIN_INTERVAL_TIME from DBA_HIST_SNAPSHOT
where BEGIN_INTERVAL_TIME between to_timestamp('09-JAN-2007 07:00:00','DD-MON-YYYY HH24:MI:SS')and to_timestamp('09-JAN-2007 10:00:00','DD-MON-YYYY HH24:MI:SS')
5064 09-JAN-07 09.00.45.370 AM
5062 09-JAN-07 07.00.45.786 AM
5063 09-JAN-07 08.00.47.623 AM
• Find the sql ids of statements which meet the criteria
SQL> select sql_id,ELAPSED_TIME_TOTAL,ELAPSED_TIME_DELTA from
dba_hist_sqlstat where snap_id between 5062 and 5064 and ELAPSED_TIME_TOTAL > 3600000000
5umujs4y5q05f 252683861535 14085330457
5umujs4y5q05f 266739511867 14055650332
5umujs4y5q05f 280852257550 14112745683
• Find the sql statement corresponding to this sql_id
SQL> select sql_text from dba_hist_sqltext where sql_id='5umujs4y5q05f';
SELECT A.JOURNAL_ID, B.SOURCE, B.ACCOUNTING_PERIOD, A.ACCOUNT, A.DEPTID, A.PROJE
CT_ID, A.CLASS_FLD, A.MONETARY_AMOUNT, A.LINE_DESCR, A.JRNL_LN_REF, TO_CHAR(A.JO
URNAL_DATE,'YYYY-MM-DD'), B.JRNL_HDR_STATUS, TO_CHAR(SYSDATE,'YYYY-MM-DD') FR
OM PS_JRNL_LN A, PS_JRNL_HEADER B, PS_DEPT_TBL C WHERE B.BUSINESS_UNIT = A.BU
SINESS_UNIT AND B.JOURNAL_ID = A.JOURNAL_ID AND B.JOURNAL_DATE = A.JOU
RNAL_DATE AND B.UNPOST_SEQ = A.UNPOST_SEQ AND ( C.EFFDT = (SE
LECT MAX(C_ED.EFFDT) FROM PS_DEPT_TBL C_ED WHERE C.SETID = C_ED.SETID
AND C.DEPTID = C_ED.DEPTID AND C_ED.EFFDT <= SYSDATE)
AND A.BUSINESS_UNIT = 'UNSYD' AND A.LEDGER = 'ACTUALS' AND A.CURREN
CY_CD = 'AUD' AND C.DEPTID = A.DEPTID AND B.FISCAL_YEAR = :1 A
ND B.ACCOUNTING_PERIOD BETWEEN :2 AND :3 AND ( A.ACCOUNT = :4 OR A.A
CCOUNT = :5 OR ( A.ACCOUNT = :6 OR A.ACCOUNT = :7 AND A.JOURNA
L_ID IN (SELECT D.JOURNAL_ID FROM PS_JRNL_LN D WHERE ( D.ACCOUNT = :8
OR D.ACCOUNT = :9)))) AND B.JRNL_HDR_STATUS IN ('P','U') ) ORDER BY 3
, 1, 4
You can obtain the same result with a single statement using the dbms_sqltune.select_workload_repository API as shown below
SELECT VALUE(P).sql_text FROM table(dbms_sqltune.select_workload_repository(5062,5064,'elapsed_time > 3600000000')) P ;
SELECT A.JOURNAL_ID, B.SOURCE, B.ACCOUNTING_PERIOD, A.ACCOUNT, A.DEPTID, A.PROJE
CT_ID, A.CLASS_FLD, A.MONETARY_AMOUNT, A.LINE_DESCR, A.JRNL_LN_REF, TO_CHAR(A.JO
URNAL_DATE,'YYYY-MM-DD'), B.JRNL_HDR_STATUS, TO_CHAR(SYSDATE,'YYYY-MM-DD') FR
OM PS_JRNL_LN A, PS_JRNL_HEADER B, PS_DEPT_TBL C WHERE B.BUSINESS_UNIT = A.BU
SINESS_UNIT AND B.JOURNAL_ID = A.JOURNAL_ID AND B.JOURNAL_DATE = A.JOU
RNAL_DATE AND B.UNPOST_SEQ = A.UNPOST_SEQ AND ( C.EFFDT = (SE
LECT MAX(C_ED.EFFDT) FROM PS_DEPT_TBL C_ED WHERE C.SETID = C_ED.SETID
AND C.DEPTID = C_ED.DEPTID AND C_ED.EFFDT <= SYSDATE)
AND A.BUSINESS_UNIT = 'UNSYD' AND A.LEDGER = 'ACTUALS' AND A.CURREN
CY_CD = 'AUD' AND C.DEPTID = A.DEPTID AND B.FISCAL_YEAR = :1 A
ND B.ACCOUNTING_PERIOD BETWEEN :2 AND :3 AND ( A.ACCOUNT = :4 OR A.A
CCOUNT = :5 OR ( A.ACCOUNT = :6 OR A.ACCOUNT = :7 AND A.JOURNA
L_ID IN (SELECT D.JOURNAL_ID FROM PS_JRNL_LN D WHERE ( D.ACCOUNT = :8
OR D.ACCOUNT = :9)))) AND B.JRNL_HDR_STATUS IN ('P','U') ) ORDER BY 3
, 1, 4
P.S You have to be licensed to use the Diagnostics Pack to use AWR and licensed to use Oracle Tuning Pack to use SQL Tuning Sets. For more information please refer to the Oracle Licensing documentation at
http://download-west.oracle.com/docs/cd/B19306_01/license.102/b14199/options.htm#sthref80
Subscribe to:
Posts (Atom)